Search Console でのパフォーマンス データのフィルタリングと制限の詳細
コレクションでコンテンツを整理
必要に応じて、コンテンツの保存と分類を行います。
2022 年 10 月 19 日(水曜日)
Google 検索のパフォーマンス データは、パフォーマンス レポートと Search Analytics API を通じて最も広く利用されているデータです。このブログ投稿では、プライバシー フィルタリングや、待ち時間、ストレージ、処理リソースに関連するその他の制限事項を含め、利用可能なデータと Google がそれを処理する方法について、詳しく説明します。こうしたシステムの仕組みが気になったことはありませんか?詳しく見てみましょう。
Search Console を初めて利用する場合は、パフォーマンス レポートの概要に関するページをご覧ください。
検索パフォーマンス レポートには、検索トラフィックの経時的な変化を示す 4 つの指標が含まれています。各指標の計算方法について説明している記事の概要を以下に記載します。
- クリック数: ユーザーが Google 検索の検索結果をクリックしてプロパティに移動した回数。
- 表示回数: ユーザーが Google 検索の検索結果でプロパティを表示した回数。
- CTR(クリック率): クリック数を表示回数で割った値。
- 掲載順位: URL、クエリ、またはウェブサイトの一般的な検索結果の平均掲載順位。
こうした指標はそれぞれ、さまざまなディメンションに関して分析できます。ウェブサイトへのトラフィック増加の要因となった各クエリ、ページ、国、デバイス、検索での見え方を確認できます。
検索のパフォーマンス データには、プロダクト インターフェース、Search Analytics API、Looker Studio コネクタ、スプレッドシート(インターフェースから手動でダウンロードする必要があります)など、さまざまな方法でアクセスできます。
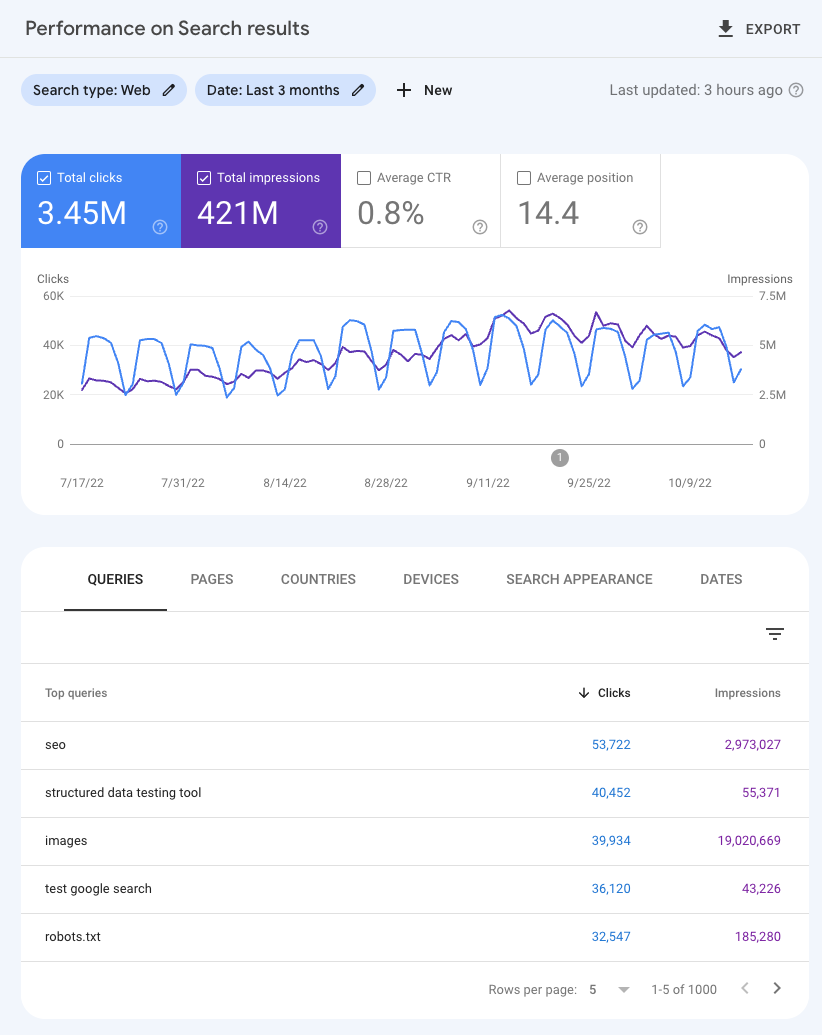
プロダクト インターフェースを使用している場合は、以下の画像に示すように、フィルタまたはグラフの下に表示されているディメンション テーブルを介してディメンションを使用できます。
このデータを利用して、ウェブサイトの視認性を高め、最終的に Google からのトラフィック増加を実現する方法を見つけることができます。実施可能な分析の種類のサンプルについては、こちらのサンプル最適化グラフをご覧ください。
データのフィルタリングと制限
レポート インターフェースのデータとエクスポートされたデータの両方が、異なる方法で集計され、フィルタされます。データの主な制限事項は 2 つあります。プライバシー フィルタリングと、1 日あたりのデータの行数制限です。
プライバシー フィルタリング
一部のクエリ(匿名化されたクエリ)は、クエリを行ったユーザーのプライバシーを保護するため、Search Console のデータに含まれません。
匿名化されたクエリは、2~3 か月間に数十人未満のユーザーが発行したクエリです。プライバシー保護のため、実際の検索語句は検索のパフォーマンス データに表示されません。そのため、このようなクエリを匿名化されたクエリと呼んでいます。実際の匿名化されたクエリは常にテーブルから除外されますが、クエリでフィルタしない限りグラフの合計に含まれます。
具体例を見てみましょう。この図はプライバシー フィルタリングのみを考慮したものです。1 日のデータの行数制限については次のセクションで説明しますが、ここでも重要な役割を果たします。この点について詳しく説明します。以下の表に、ウェブサイトへのクエリに関するすべてのトラフィックについて、匿名化されていないクエリに関連するトラフィックを項目別に示します。一般的なウェブサイトでは、通常 4 つを超える項目が匿名化されていないクエリとなりますが、この例では項目を 4 つに絞っています。
クエリ
|
クリック数
|
古典文学
|
150
|
詩
|
125
|
サイエンス フィクション
|
100
|
ノンフィクション
|
75
|
各項目のクエリの合計
|
450
|
合計
|
550
|
各項目のクエリを合計すると、グラフに示すように、クリック数は 450 回です。また、サイト全体のクリック数は 550 回です。この数値は、各項目のすべてのクリック数と、一覧に表示されていない匿名化されたクエリに関連するクリック数の両方を含むため、大きな値になります。
実際には、Search Console のレポートを使用する場合、主に次の 2 つのケースでこの種の不一致が見られます。
- 匿名化されたクエリに関する行は、レポート テーブルまたは API(ここでは説明のために追加)には存在しないため、すべての行のクリック数を合計すると、グラフの合計クリック数と一致しません。たとえば、この場合は行の合計クリック数は 450 ですが、グラフの合計クリック数は 550 です。
- フィルタが適用されるたびに匿名化されたクエリが省略されるため、グラフの合計クリック数と、
some_string
を含むクリック数と some_string
を含まないクリック数の合計を比較した場合、差異が生じます。この例では、フィルタを使用して「フィクション」という単語を含むクエリのみにしたときのクリック数は 175、反対に「フィクション」という単語を含むクエリを除外したときのクリック数は 275 で、合計 450 になります。一方、グラフの合計クリック数は 550 と表示されます。
1 日あたりのデータの行数制限
待ち時間、ストレージ、処理リソースなどに関連する制限により、Search Console では表示またはエクスポートできるデータ量に制限があります。この制限は、Search Console の大部分のプロパティには影響しません。ごく一部の非常に大規模なウェブサイトは影響を受ける可能性がありますが、そのような場合でも、残りのデータはデータの代表サンプルを作成するために十分な大きさであると考えられます。
Search Console のユーザー インターフェースでエクスポートできるデータは最大で 1,000 行です。現在、Search Analytics API(および Looker Studio コネクタ)を通じてエクスポートされるデータの上限は、サイトごと、検索タイプごとに 1 日あたり 50,000 行です。これに達しない場合もあります。API が返すデフォルトは 1,000 行ですが、rowLimit
を使用して 25,000 行まで増やせます。startRow
を使用すると、ページ分けをして 25,001~50,000 行まで増やせます。利用可能なデータの取得方法に関するガイドをご覧ください。
国、デバイス、検索での見え方など、クエリまたは URL ディメンションを伴わないリクエストの場合、Search Console はすべてのデータを表示し、エクスポートします。
リソースとフィードバック
このテーマの詳細については、パフォーマンスに関するドキュメントをご覧ください。利用可能なデータ、パフォーマンス レポートの使用方法、グラフで生じるデータの不一致について、詳しく記載されています。
ご不明な点や気になる点がございましたら、Google 検索セントラル コミュニティまたは Twitter でお問い合わせください。
Posted by Daniel Waisberg, Search Advocate
特に記載のない限り、このページのコンテンツはクリエイティブ・コモンズの表示 4.0 ライセンスにより使用許諾されます。コードサンプルは Apache 2.0 ライセンスにより使用許諾されます。詳しくは、Google Developers サイトのポリシーをご覧ください。Java は Oracle および関連会社の登録商標です。
[null,null,[],[[["\u003cp\u003eGoogle Search Console's Performance report provides data on clicks, impressions, CTR, and position to analyze website search traffic.\u003c/p\u003e\n"],["\u003cp\u003eSearch performance data can be accessed via the product interface, Search Analytics API, Looker Studio Connector, and manual spreadsheet downloads.\u003c/p\u003e\n"],["\u003cp\u003eData is subject to privacy filtering, meaning some queries are anonymized to protect user privacy and may lead to discrepancies in total click counts.\u003c/p\u003e\n"],["\u003cp\u003eA daily data row limit exists for exported data, capped at 1,000 rows via the user interface and 50,000 via the API or Looker Studio Connector.\u003c/p\u003e\n"],["\u003cp\u003eComprehensive resources and support are available through Google Search Central Community and Twitter for further assistance.\u003c/p\u003e\n"]]],["Google Search Console's Performance report provides data on clicks, impressions, CTR, and position, which can be analyzed across queries, pages, countries, devices, and search appearances. Access is available through the interface, API, Looker Studio, and spreadsheets. Data is filtered for user privacy, omitting anonymized queries from tables but including them in totals, and has limits of 1,000 rows via the interface or up to 50,000 via API per day.\n"],null,["# A deep dive into Search Console performance data filtering and limits\n\nWednesday, October 19, 2022\n\n\nGoogle Search performance data is the most widely used data in Search Console, both through the\n[Performance report](https://support.google.com/webmasters/answer/7576553)\nand the [Search Analytics API](/webmaster-tools/v1/searchanalytics/query).\nThis post explains in detail the data available and how Google processes it, including privacy\nfiltering and other limitations related to serving latency, storage, and processing resources.\nEver wonder how these systems work? Let's do a deep dive\ninto them.\n\n\nIf you're new to Search Console, check out the [introduction to Performance reports](https://support.google.com/webmasters/answer/10268906).\n\nSearch performance basics\n-------------------------\n\n\nThe Performance report contains four metrics that show how your search traffic changes over time.\nWe have an article describing [how each metric is calculated](https://support.google.com/webmasters/answer/7042828),\nand here's a summary:\n\n- Clicks: Count of user clicks from Google Search results to your property.\n- Impressions: Count of times users saw your property on Google search results.\n- CTR (Click-through rate): The click count divided by the impression count.\n- Position: The average position in search results for the URL, query, or for the website in general.\n\n\nEach of those metrics can be analyzed for different dimensions. You can check how each of the queries,\npages, countries, devices, or search appearances driving traffic to your website is performing.\n\n\nThere are many ways to access the Search performance data, including the\n[product interface](https://search.google.com/search-console/performance/search-analytics),\nthe [Search Analytics API](/webmaster-tools/v1/searchanalytics/query),\nthe [Looker Studio connector](/search/blog/2022/03/connecting-data-studio),\nand spreadsheets (requires manual download from the interface).\n\n\nIf you're using the product interface, the dimensions are available through the filters or through\nthe dimensions tables following the chart, as shown in the image below.\n\n\nThis data can be used to find ways to make your website more visible and ultimately get more traffic\nout of Google. For a sample of what type of analysis you can perform, check this\n[sample optimization chart](/search/blog/2022/04/performance-optimization-bubble-chart).\n\nData filtering and limits\n-------------------------\n\n\nBoth the data in the report interface and the data exported are aggregated and filtered in different\nways. Below are the two main limitations to the data: privacy filtering and daily data row limit.\n\n### Privacy filtering\n\n\nSome queries (called anonymized queries) are not included in Search Console data to protect the\nprivacy of the user making the query.\n\n\nAnonymized queries are those that aren't issued by more than a few dozen users over a two-to-three\nmonth period. To protect privacy, the actual queries won't be shown in the Search performance data.\nThis is why we refer to them as anonymized queries. While the actual anonymized queries are always\nomitted from the tables, they are included in chart totals, unless you filter by query.\n\n\nLet's look at an example to make it clearer - note that this is an illustration that takes into\naccount only privacy filtering, but daily data row limits, discussed in the next section, may also\nplay a role, read on to learn more. Let's say the table below shows all the traffic for queries to\nyour website, itemizing the traffic from non-anonymized queries. A typical website will generally\nhave more than four itemized non-anonymized queries, of course, but for purposes of this example,\nwe'll say it's just four that are itemized.\n\n|------------------------------|------------|\n| **Queries** | **Clicks** |\n| classic literature | 150 |\n| poetry | 125 |\n| science fiction | 100 |\n| non fiction | 75 |\n| *Total for itemized queries* | *450* |\n| *Total overall* | *550* |\n\n\nIf you add up all the itemized queries, as the chart shows, there were 450 clicks. There are also\n550 overall clicks to the site. That number is higher because it includes all the itemized clicks\nplus the clicks from anonymized queries, which aren't listed.\n\n\nIn practice, when using Search Console reporting, you may notice this type of discrepancy in two main ways.\n\n1. There is no row for anonymized queries in the report table or API (added here for illustration purposes), so if you sum up clicks for all the rows, you'll not find the same number of clicks as the chart totals. For example in this case you'd see 450 when you sum up the rows, but you'd see 550 in the chart totals.\n2. The anonymized queries are omitted whenever a filter is applied, so there will be a discrepancy if you compare the sum of clicks in the chart totals to the sum of clicks containing `some_string` and not containing `some_string`. In this case, if you use filters to include only queries that contain the word \"fiction\", you'll see 175 clicks, and if you exclude queries that contain the word \"fiction\", you'll see 275 clicks, summing up to 450 clicks, while in the chart total you'll see 550 clicks.\n\n### Daily data row limit\n\n\nDue to limitations related to serving latency, storage, processing resources, and others, Search\nConsole has a limit on the amount of data that can be displayed or exported. These limits won't affect\nthe majority of properties in Search Console. A few very large websites can be affected by this, but\neven for those we believe the remaining data will be large enough to create a representative sample of data.\n\n\nThe maximum you can export through the Search Console user interface is 1,000 rows of data.\nCurrently, the upper limit for the data exported through the [Search Analytics API](/webmaster-tools/v1/searchanalytics/query)\n(and through the [Looker Studio connector](/search/blog/2022/03/connecting-data-studio))\nis 50,000 rows per day per site per search type, which may not be reached in all cases. The default\nreturned by the API will be 1,000 rows, but you can use `rowLimit` to increase it to 25,000\nand `startRow` to pull the rows 25,001 to 50,000 using pagination. Check this guide to\nlearn [how to get the available data](/webmaster-tools/v1/how-tos/all-your-data).\n\n\nFor requests that don't involve query or URL dimensions, such as countries, devices, and Search\nAppearances, Search Console will display and export all the data.\n\nResources and feedback\n----------------------\n\n\nIf you'd like to learn more about the subject, read the [Performance documentation](https://support.google.com/webmasters/answer/7576553).\nYou'll find in-depth explanations about the available data, how to use the Performance report, and more\ndetails about discrepancies you may find in the charts.\n\n\nIf you have any questions or concerns, please reach out to us via the\n[Google Search Central Community](https://support.google.com/webmasters/threads?thread_filter=(category:search_console))\nor on [Twitter](https://twitter.com/googlesearchc).\n\nPosted by [Daniel Waisberg](https://www.danielwaisberg.com), Search Advocate"]]