ui.Panel는 위젯을 배치하는 상위 UI 컨테이너입니다. 각 ui.Panel에는 위젯이 화면에 정렬되는 방식을 제어하는 ui.Panel.Layout 객체가 있습니다. 레이아웃 섹션에서 자세히 알아보세요. 패널은 추가된 위젯 목록 (다른 패널을 포함할 수 있음)도 유지합니다. 패널에서 위젯을 관리하려면 패널에서 add() 또는 remove()하거나 패널에서 widgets()를 호출하여 위젯 목록을 가져옵니다. 위젯 목록은 ui.data.ActiveList의 인스턴스이므로 목록과 그 안에 있는 위젯을 조작하여 패널을 구성할 수 있습니다.
ui.root
ui.root는 가로 막대 아래의 코드 편집기의 모든 항목에 대한 ui.Panel의 고정된 인스턴스입니다. 기본적으로 기본 지도라는 단일 위젯만 포함됩니다. 특히 ui.root.widgets().get(0)의 항목은 코드 편집기에 기본적으로 표시되는 Map 객체 (ui.Map의 인스턴스)입니다. 기본 지도의 Map 별칭 외의 유일한 특징은 도형 편집 도구가 포함되어 있다는 점입니다. UI를 빌드할 빈 캔버스를 가져오려면 ui.root에서 기본 맵을 clear()합니다.
이 예에서는 기본 지도를 패널로 취급하고 여기에 위젯을 추가하여 Map를 수정합니다. 지도에는 절대 레이아웃이 있으므로 지도에서 위젯의 위치는 위젯의 style 속성의 position 속성에 따라 결정됩니다. 자세한 내용은 절대 레이아웃 섹션을 참고하세요.
Code 편집기 링크를 다른 사용자와 공유하면 기본적으로 ui.root이 창의 대부분을 차지하고 텍스트 편집기, Docs 패널, 콘솔이 숨겨집니다. ui.root 레이아웃을 제어하여 다른 사용자가 스크립트를 사용하는 방식을 제어할 수 있습니다.
레이아웃
레이아웃은 패널의 위젯이 표시되도록 정렬되는 방식을 제어합니다. 레이아웃 옵션에는 아래에 설명된 흐름 레이아웃과 절대 레이아웃의 두 가지가 있습니다. 레이아웃은 ui.Panel.Layout 클래스로 지정됩니다. 생성자 또는 setLayout()를 사용하여 패널의 레이아웃을 설정합니다. 위젯이 추가되는 순서에 따라 흐름 레이아웃이 적용된 패널에 위젯이 정렬되는 방식이 결정됩니다. 각 위젯의 style에 있는 position 속성은 절대 레이아웃이 있는 패널에서 위젯이 정렬되는 방식을 결정합니다. 위젯의 스타일이 위젯이 배치된 레이아웃과 관련이 없는 경우 무시됩니다.
흐름
흐름 레이아웃은 행 ('horizontal') 또는 열('vertical')에 위젯을 표시합니다. 위젯은 패널에 추가된 순서대로 정렬됩니다. 예를 들어 패널에 추가된 다음 버튼을 생각해 보세요.
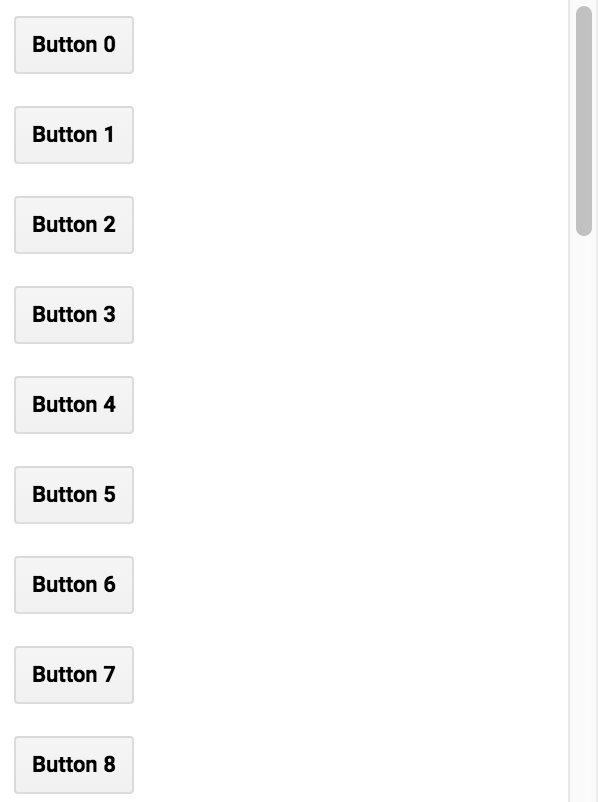
패널의 width는 300픽셀로 설정되고 stretch는 style 속성으로 'horizontal'로 설정됩니다. stretch 스타일 속성은 흐름 레이아웃이 있는 패널의 위젯에 적용됩니다. 예를 들어 {stretch: 'horizontal'}는 위젯이 패널 내에서 사용 가능한 가로 공간을 채우도록 확장됨을 의미합니다. 이전 예에서 흐름 레이아웃 유형을 'horizontal'로 변경하면 버튼이 열이 아닌 행으로 정렬된 것을 볼 수 있습니다.
가로 흐름 패널에서 가로로 늘어난 위젯은 다른 모든 위젯이 자연 너비를 차지한 후 사용 가능한 공간을 채우도록 확장됩니다. 위젯이 두 개 이상 가로로 늘어나면 사용 가능한 가로 공간이 위젯 간에 분할됩니다. 세로로 늘어난 위젯은 패널의 높이를 채우도록 확장됩니다.
세로 흐름 패널에서 세로로 늘어난 위젯은 다른 모든 위젯이 자연 높이를 차지한 후 사용 가능한 공간을 채우도록 확장됩니다. 위젯이 세로로 늘어나는 경우 사용 가능한 세로 공간이 위젯 간에 분할됩니다. 가로로 늘어난 위젯은 패널의 너비를 채우도록 확장됩니다.
절대
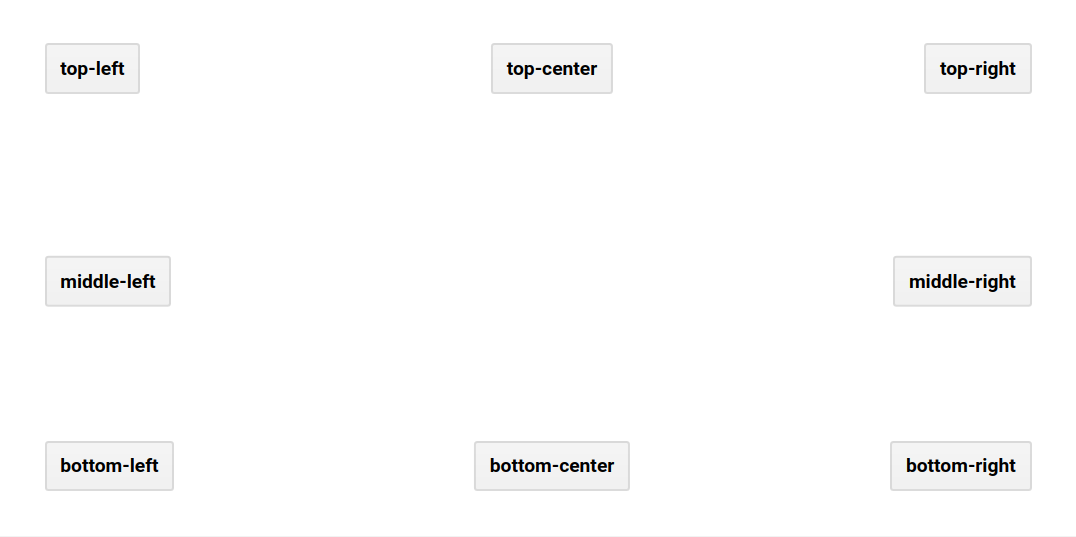
절대 레이아웃은 패널의 위치에 따라 위젯을 배치합니다. 흐름 레이아웃과 달리 위젯의 위치는 패널에 추가되는 순서가 아니라 위젯의 style 속성의 position 속성에 따라 결정됩니다. 다음 예는 절대 레이아웃으로 root.ui 패널을 사용하는 방법을 보여줍니다 (루트 패널의 레이아웃은 기본적으로 가로 흐름이지만 ui.root.setLayout()로 설정할 수 있음).
패널에 위젯을 추가하면 패널의 위젯 목록에 위젯이 추가됩니다. 패널에서 widgets()를 호출하면 패널의 위젯을 조작하는 데 사용할 수 있는 ui.data.ActiveList가 반환됩니다. 다음 예를 살펴보세요. 패널에 위젯을 추가하고 패널을 루트 패널에 추가한 다음 사용자가 지도를 클릭하면 차트를 업데이트합니다.
이 예에서는 먼저 add()를 사용하여 위젯이 패널에 추가되는 것을 볼 수 있습니다. 클릭을 매핑하도록 등록된 콜백 함수에서 panel의 위젯 목록이 대신 수정됩니다. 특히 세 번째 위젯 (존재할 수도 있고 아닐 수도 있음)은 시간 경과에 따른 NDVI의 새 차트가 표시되도록 설정됩니다. 이벤트 페이지에서 이벤트 처리 함수에 대해 자세히 알아보세요.
[null,null,["최종 업데이트: 2025-07-25(UTC)"],[[["\u003cp\u003e\u003ccode\u003eui.Panel\u003c/code\u003e objects arrange widgets within a UI and use layouts to control their display, offering two options: flow and absolute.\u003c/p\u003e\n"],["\u003cp\u003e\u003ccode\u003eui.root\u003c/code\u003e is the main panel in the Code Editor, initially containing the default map, which can be cleared or modified by adding widgets.\u003c/p\u003e\n"],["\u003cp\u003eFlow layouts arrange widgets sequentially in a row or column, with stretching options to fill available space within the panel.\u003c/p\u003e\n"],["\u003cp\u003eAbsolute layouts position widgets based on the \u003ccode\u003eposition\u003c/code\u003e property in their style, allowing precise placement within the panel.\u003c/p\u003e\n"],["\u003cp\u003eThe \u003ccode\u003ewidgets()\u003c/code\u003e method allows direct manipulation of a panel's widget list, enabling dynamic updates and changes to the UI.\u003c/p\u003e\n"]]],[],null,["# Panels and Layouts\n\nPanels\n------\n\nA `ui.Panel` is an upper-level UI container in which to arrange widgets. Each\n`ui.Panel` has a `ui.Panel.Layout` object that controls how its\nwidgets are arranged on the screen. Learn more in the [Layouts\nsection](/earth-engine/guides/ui_panels#layouts). Panels also maintain a list of widgets (which could include other panels)\nthat have been added to them. To manage widgets in the panel, either `add()`\nor `remove()` them from the panel, or retrieve the list of widgets by calling\n`widgets()` on the panel. The widgets list is an instance of\n`ui.data.ActiveList`, which means that you can configure the panel by manipulating\nthe list and the widgets in it.\n\nui.root\n-------\n\nThe `ui.root` is a fixed instance of a `ui.Panel` for everything\nin the Code Editor below the horizontal bar. By default, it contains only a single\nwidget: the default map. Specifically, the item at `ui.root.widgets().get(0)`\nis the `Map` object (an instance of `ui.Map`) that is displayed\nby default in the Code Editor). In addition to the `Map` alias, the only\nother special thing about the default Map is that it has geometry editing tools in it. To\nobtain an empty canvas in which to build your UI, `clear()` the default map\nout of `ui.root`:\n\n### Code Editor (JavaScript)\n\n```javascript\nui.root.clear();\n```\n\nAlternatively, it's possible to modify the default map in the root panel by adding\nwidgets to it. Specifically, think of a map as a panel with an absolute layout (see the\n[Layouts section](/earth-engine/guides/ui_panels#layouts) for details). The following example\nillustrates a modification of the default map:\n\n### Code Editor (JavaScript)\n\n```javascript\n// Load a VIIRS surface reflectance image and display on the map.\nvar image = ee.Image('NOAA/VIIRS/001/VNP09GA/2022_06_05').select('M.*');\nMap.addLayer(image, {bands: ['M5', 'M4', 'M3'], min: 0, max: 4e3, gamma: 1.5});\n\n// Create the title label.\nvar title = ui.Label('Click to inspect');\ntitle.style().set('position', 'top-center');\nMap.add(title);\n\n// Create a panel to hold the chart.\nvar panel = ui.Panel();\npanel.style().set({\n width: '400px',\n position: 'bottom-right'\n});\nMap.add(panel);\n\n// Register a function to draw a chart when a user clicks on the map.\nMap.style().set('cursor', 'crosshair');\nMap.onClick(function(coords) {\n panel.clear();\n var point = ee.Geometry.Point(coords.lon, coords.lat);\n var chart = ui.Chart.image.regions(image, point, null, 30);\n chart.setOptions({title: 'Band values'});\n panel.add(chart);\n});\n```\n\nNote that the example modifies the default map (which is `Map`) by treating\nit as a panel and adding widgets to it. Because maps have absolute layout, the position\nof a widget on a map is determined by a `position` property of the\n`style` property of the widget. See the [absolute\nlayout section](/earth-engine/guides/ui_panels#absolute) for details.\n\nWhen you share a Code Editor link with another user, by default the `ui.root`\ntakes up most of the window, and the text editor, docs panel, and console are hidden. By\ncontrolling the `ui.root` layout, you can control how other users experience\nyour script.\n\nLayouts\n-------\n\nLayouts control how widgets in a panel are arranged for display. There are two layout\noptions, described below: flow layout and absolute layout. Layouts are specified with\nthe `ui.Panel.Layout` class. Set a panel's layout either in the constructor\nor with `setLayout()`. The order in which widgets are added determines\nhow widgets are arranged in a panel with flow layout. The `position` property\neach widget's `style` determines how a widget will be arranged in a panel\nwith absolute layout. If the style on a widget is irrelevant for the layout in which\nthe widget is placed, it's ignored.\n\n### Flow\n\nA flow layout displays widgets in a row (`'horizontal'`) or a column\n(`'vertical'`). The widgets are arranged according to the order in which\nthey are added to the panel. For example, consider the following buttons added to a panel:\n\n### Code Editor (JavaScript)\n\n```javascript\n// Create a panel with vertical flow layout.\nvar panel = ui.Panel({\n layout: ui.Panel.Layout.flow('vertical'),\n style: {width: '300px'}\n});\n\n// Add a bunch of buttons.\nfor (var i = 0; i \u003c 30; i++) {\n panel.add(ui.Button({label: 'Button ' + i, style: {stretch: 'horizontal'}}));\n}\n\nui.root.clear();\nui.root.add(panel);\n```\n\nThe vertical layout should look something like:\n\nNote that the `width` of the panel is set to 300 pixels and the\n`stretch` is set to `'horizontal'` with the `style`\nproperty. The `stretch` style property applies to widgets in a panel with\nflow layout. For example, `{stretch: 'horizontal'}` means the widget will\nexpand to fill available horizontal space within the panel. In the previous example,\nchange the flow layout type to `'horizontal'` to see the buttons arranged\nin a row instead of a column.\n\nIn a horizontal flow panel, a horizontally stretched widget expands to fill the space\navailable after all other widgets have taken up their natural *widths* . If more\nthan one widget is stretched horizontally, then the available horizontal space is\nsplit among them. A vertically stretched widget expands to fill the *height*\nof the panel.\n\nIn a vertical flow panel, a vertically stretched widget expands to fill the space\navailable after all other widgets have taken up their natural *heights* . If\nmore than one widget is stretched vertically, then the available vertical space is\nsplit among them. A horizontally stretched widget expands to fill the *width*\nof the panel.\n\n### Absolute\n\nAn absolute layout positions widgets according to positions in the panel. Unlike the\nflow layout, the position of a widget is determined by the `position` property\nof the widget's `style` property, not the order in which it is added to\nthe panel. The following example demonstrates using the `root.ui` panel with\nan absolute layout (the root panel's layout is a horizontal flow by default, but can be\nset with `ui.root.setLayout()`):\n\n### Code Editor (JavaScript)\n\n```javascript\nui.root.clear();\nui.root.setLayout(ui.Panel.Layout.absolute());\n\n// A function to make buttons labeled by position.\nfunction makeButton(position) {\n return ui.Button({\n label: position,\n style: {position: position}\n });\n}\n\n// Add labeled buttons to the panel.\nui.root.add(makeButton('top-left'));\nui.root.add(makeButton('top-center'));\nui.root.add(makeButton('top-right'));\nui.root.add(makeButton('middle-left'));\nui.root.add(makeButton('middle-right'));\nui.root.add(makeButton('bottom-left'));\nui.root.add(makeButton('bottom-center'));\nui.root.add(makeButton('bottom-right'));\n```\n\nThe absolute layout panel should look something like:\n\n`widgets()`\n-----------\n\nWhen you add a widget to a panel, it adds the widget to the panel's list of\nwidgets. Calling `widgets()` on the panel returns the\n`ui.data.ActiveList` which you can use to manipulate the widgets in the\npanel. Consider the following example, which adds widgets to a panel, adds the panel\nto the root panel, then updates a chart when the user clicks on the map:\n\n### Code Editor (JavaScript)\n\n```javascript\n// Load and display NDVI data.\nvar ndvi = ee.ImageCollection('NOAA/VIIRS/001/VNP13A1')\n .filterDate('2021-01-01', '2022-01-01').select('NDVI');\nMap.addLayer(\n ndvi.median(), {min: 0, max: 10000, palette: ['99c199', '006400']}, 'NDVI');\n\n// Configure the map.\nMap.setCenter(-94.84497, 39.01918, 8);\nMap.style().set('cursor', 'crosshair');\n\n// Create an empty panel in which to arrange widgets.\n// The layout is vertical flow by default.\nvar panel = ui.Panel({style: {width: '400px'}})\n .add(ui.Label('Click on the map'));\n\n// Set a callback function for when the user clicks the map.\nMap.onClick(function(coords) {\n // Create or update the location label (the second widget in the panel)\n var location = 'lon: ' + coords.lon.toFixed(2) + ' ' +\n 'lat: ' + coords.lat.toFixed(2);\n panel.widgets().set(1, ui.Label(location));\n\n // Add a red dot to the map where the user clicked.\n var point = ee.Geometry.Point(coords.lon, coords.lat);\n Map.layers().set(1, ui.Map.Layer(point, {color: 'FF0000'}));\n\n // Create a chart of NDVI over time.\n var chart = ui.Chart.image.series(ndvi, point, ee.Reducer.mean(), 200)\n .setOptions({\n title: 'NDVI Over Time',\n vAxis: {title: 'NDVI'},\n lineWidth: 1,\n pointSize: 3,\n });\n\n // Add (or replace) the third widget in the panel by\n // manipulating the widgets list.\n panel.widgets().set(2, chart);\n});\n\n// Add the panel to the ui.root.\nui.root.add(panel);\n```\n\nIn this example, observe that first, widgets are added to panel using\n`add()`. In the callback function registered to map clicks, `panel`'s\nlist of widgets is modified instead. Specifically, the third widget (which may or may\nnot exist) is set such that a new chart is displayed of NDVI over time. Learn more about\nevent handling functions on the [Events page](/earth-engine/guides/ui_events)."]]