Ankündigung: Alle nicht kommerziellen Projekte, die vor dem 15. April 2025 für die Nutzung der Earth Engine registriert wurden, müssen die Berechtigung zur nicht kommerziellen Nutzung bestätigen, um weiterhin auf die Earth Engine zugreifen zu können.
Mit Sammlungen den Überblick behalten
Sie können Inhalte basierend auf Ihren Einstellungen speichern und kategorisieren.
Jährlichen Waldverlust berechnen
Im vorherigen Abschnitt haben Sie gelernt, wie Sie mit der Methode reduceRegion die Gesamtfläche des verlorenen Waldes in der angegebenen Region von Interesse berechnen. Anstatt den Gesamtverlust zu berechnen, wäre es hilfreich, den Verlust für jedes Jahr zu berechnen. In Earth Engine erreichen Sie dies mit einem gruppierten Reduzierer.
Wenn Sie die Ausgabe von reduceRegion() gruppieren möchten, können Sie ein Gruppierungsband angeben, das Gruppen anhand von ganzzahligen Pixelwerten definiert. Im folgenden Beispiel wird der vorherige Code leicht geändert und dem Originalbild wird das Band lossYear hinzugefügt. Jedes Pixel im lossYear-Band enthält Werte zwischen 0 und 14, die das Jahr angeben, in dem der Verlust aufgetreten ist. Außerdem ändern wir den Reducer in einen gruppierten Reducer und geben den Bandindex des Gruppierungsbands (1) an, damit die Pixelbereiche summiert und nach dem Wert im lossYear-Band gruppiert werden.
Nachdem Sie den obigen Code ausgeführt haben, wird die jährliche Waldverlustfläche in einer verschachtelten Liste mit dem Namen groups ausgegeben. Wir können die Ausgabe etwas formatieren, damit das Ergebnis ein Dictionary mit dem Jahr als Schlüssel und dem Verlustbereich als Wert ist. Beachten Sie, dass wir die Methode format() verwenden, um die Jahreswerte von 0 bis 14 in 2000 bis 2014 zu konvertieren.
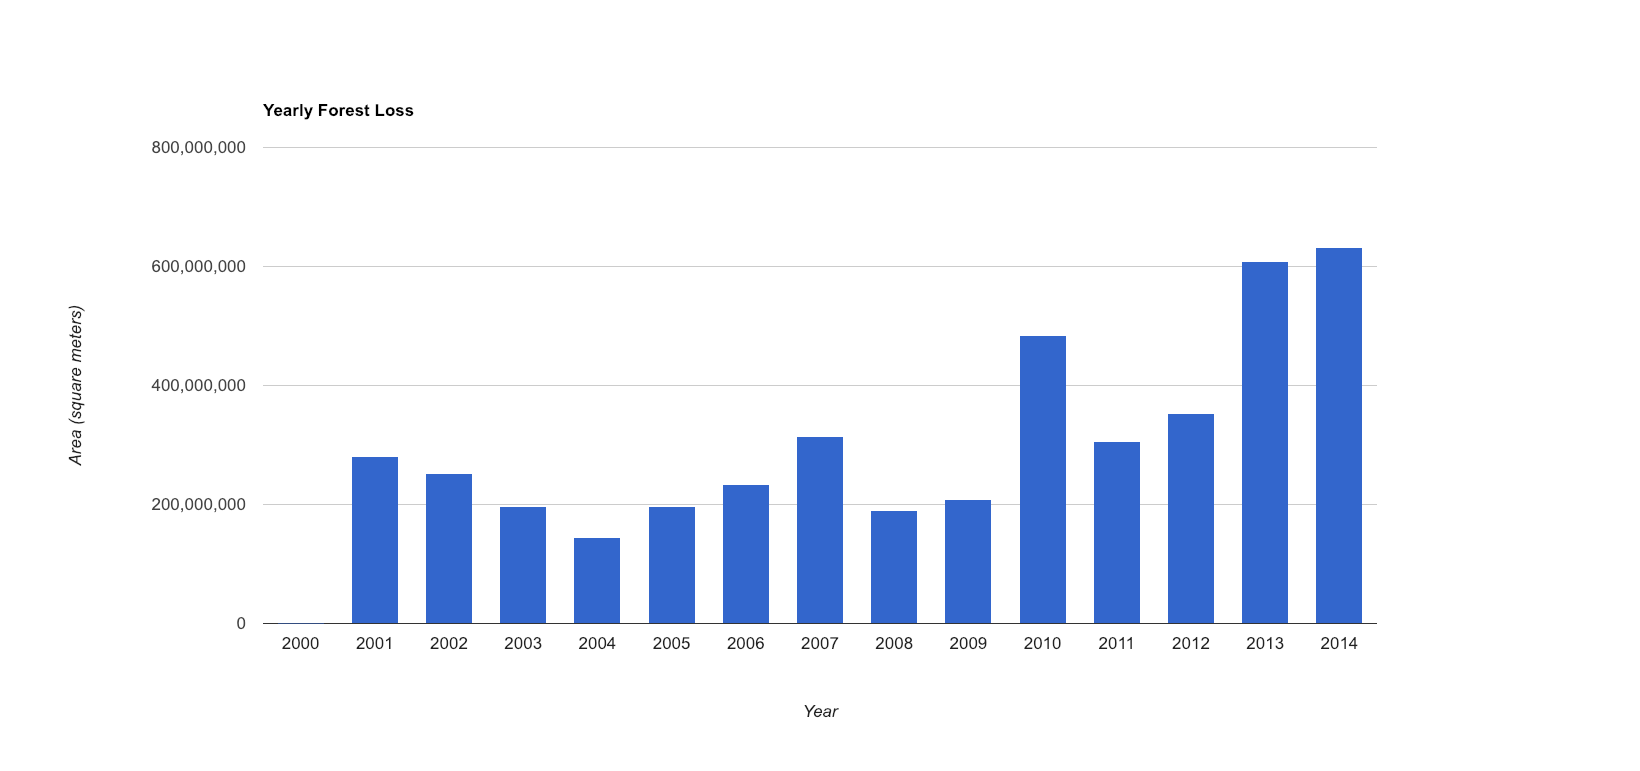
Nachdem wir nun die jährlichen Verlustzahlen haben, können wir ein Diagramm erstellen. Wir verwenden die Methode ui.Chart.array.values(). Diese Methode verwendet ein Array (oder eine Liste) von Eingabewerten und ein Array (oder eine Liste) von Labels für die X-Achse.
Das Ergebnis sollte wie im Diagramm unten aussehen.
Abbildung 1. Diagramm zum Waldverlust nach Jahr
Im nächsten Abschnitt erfahren Sie mehr über einen weiteren Datensatz zur Überwachung der Entwaldung, FORMA, und vergleichen ihn mit den Daten von Hansen et al.
[null,null,["Zuletzt aktualisiert: 2025-07-26 (UTC)."],[[["\u003cp\u003eThis tutorial demonstrates how to calculate yearly forest loss in a specific region using Google Earth Engine and grouped reducers.\u003c/p\u003e\n"],["\u003cp\u003eThe \u003ccode\u003elossYear\u003c/code\u003e band is used to categorize forest loss by year, ranging from 2000 to 2014.\u003c/p\u003e\n"],["\u003cp\u003eThe output is formatted into a dictionary where years are keys and corresponding loss areas are values.\u003c/p\u003e\n"],["\u003cp\u003eA column chart is generated to visualize yearly forest loss trends using the \u003ccode\u003eui.Chart.array.values()\u003c/code\u003e method.\u003c/p\u003e\n"],["\u003cp\u003eThe tutorial further directs users to explore and compare with other deforestation monitoring datasets.\u003c/p\u003e\n"]]],["The content demonstrates how to calculate yearly forest loss using Earth Engine. It involves adding a `lossYear` band to an image, then using a grouped reducer (`reduceRegion`) to sum pixel areas based on the year of loss (0-14). The output is formatted into a dictionary with years (2000-2014) as keys and loss areas as values. Finally, `ui.Chart.array.values()` is used to create a column chart visualizing the yearly forest loss, with years on the x-axis and loss area on the y-axis.\n"],null,["# Charting Yearly Forest Loss\n\nCalculating Yearly Forest Loss\n------------------------------\n\nIn the previous section you learned how to\n[calculate total forest area lost](/earth-engine/tutorials/tutorial_forest_03#calculating-pixel-areas) in\nthe given region of interest using the `reduceRegion` method. Instead of\ncalculating the total loss, it would be helpful to compute the loss for each year. The way\nto achieve this in Earth Engine is using a [Grouped Reducer](/earth-engine/guides/reducers_grouping).\n\n\nTo group output of `reduceRegion()`, you can specify a grouping band that\ndefines groups by integer pixel values. In the following example, we slightly modify the\nprevious code and add the `lossYear` band to the original image. Each pixel in the\n`lossYear` band contain values from 0 to 14 - indicating the year in which the\nloss occurred. We also change the reducer to a grouped reducer, specifying the band index of\nthe grouping band (1) so the pixel areas will be summed and grouped according to the value\nin the `lossYear` band.\n\n### Code Editor (JavaScript)\n\n```javascript\n// Load country boundaries from LSIB.\nvar countries = ee.FeatureCollection('USDOS/LSIB_SIMPLE/2017');\n// Get a feature collection with just the Congo feature.\nvar congo = countries.filter(ee.Filter.eq('country_co', 'CF'));\n\n// Get the loss image.\n// This dataset is updated yearly, so we get the latest version.\nvar gfc2017 = ee.Image('UMD/hansen/global_forest_change_2017_v1_5');\nvar lossImage = gfc2017.select(['loss']);\nvar lossAreaImage = lossImage.multiply(ee.Image.pixelArea());\n\nvar lossYear = gfc2017.select(['lossyear']);\nvar lossByYear = lossAreaImage.addBands(lossYear).reduceRegion({\n reducer: ee.Reducer.sum().group({\n groupField: 1\n }),\n geometry: congo,\n scale: 30,\n maxPixels: 1e9\n});\nprint(lossByYear);\n```\n\nOnce you run the above code, you will see the yearly forest loss area printed out in a nested\nlist called `groups`. We can format the output a little to make the result a\ndictionary, with year as the key and loss area as the value. Notice that we are using the\n`format()` method to convert the year values from 0-14 to 2000-2014.\n\n### Code Editor (JavaScript)\n\n```javascript\nvar statsFormatted = ee.List(lossByYear.get('groups'))\n .map(function(el) {\n var d = ee.Dictionary(el);\n return [ee.Number(d.get('group')).format(\"20%02d\"), d.get('sum')];\n });\nvar statsDictionary = ee.Dictionary(statsFormatted.flatten());\nprint(statsDictionary);\n```\n\nMaking a chart\n--------------\n\nNow that we have yearly loss numbers, we are ready to prepare a chart. We will use the\n`ui.Chart.array.values()` method. This method takes an array (or list) of input\nvalues and an array (or list) of labels for the X-axis.\n\n\n### Code Editor (JavaScript)\n\n```javascript\nvar chart = ui.Chart.array.values({\n array: statsDictionary.values(),\n axis: 0,\n xLabels: statsDictionary.keys()\n}).setChartType('ColumnChart')\n .setOptions({\n title: 'Yearly Forest Loss',\n hAxis: {title: 'Year', format: '####'},\n vAxis: {title: 'Area (square meters)'},\n legend: { position: \"none\" },\n lineWidth: 1,\n pointSize: 3\n });\nprint(chart);\n```\n\nThe result should look like the chart below.\nFigure 1. Chart of Forest Loss by Year\n\nIn the [next section](/earth-engine/tutorials/tutorial_forest_04),\nyou'll learn about another deforestation monitoring dataset,\n[FORMA](https://www.cgdev.org/sites/default/files/1423248_file_Hammer_Kraft_Wheeler_FORMA_FINAL.pdf),\nand compare it to the Hansen et al. data."]]