Annonce : Tous les projets non commerciaux enregistrés pour utiliser Earth Engine avant le 15 avril 2025 doivent vérifier leur éligibilité non commerciale pour conserver leur accès à Earth Engine.
Représenter graphiquement la perte annuelle de forêt
Restez organisé à l'aide des collections
Enregistrez et classez les contenus selon vos préférences.
Calcul de la perte annuelle de forêt
Dans la section précédente, vous avez appris à calculer la superficie totale de forêt perdue dans la région d'intérêt donnée à l'aide de la méthode reduceRegion. Au lieu de calculer la perte totale, il serait utile de calculer la perte pour chaque année. Pour ce faire dans Earth Engine, vous devez utiliser un réducteur groupé.
Pour regrouper la sortie de reduceRegion(), vous pouvez spécifier une bande de regroupement qui définit les groupes par valeurs de pixels entiers. Dans l'exemple suivant, nous modifions légèrement le code précédent et ajoutons la bande lossYear à l'image d'origine. Chaque pixel de la bande lossYear contient des valeurs comprises entre 0 et 14, qui indiquent l'année à laquelle la perte s'est produite. Nous modifions également le réducteur en un réducteur groupé, en spécifiant l'index de bande de la bande de regroupement (1) afin que les zones de pixels soient additionnées et regroupées en fonction de la valeur de la bande lossYear.
Une fois le code ci-dessus exécuté, la zone de perte forestière annuelle s'affiche dans une liste imbriquée appelée groups. Nous pouvons formater un peu la sortie pour que le résultat soit un dictionnaire, avec l'année comme clé et la zone de perte comme valeur. Notez que nous utilisons la méthode format() pour convertir les valeurs d'année de 0 à 14 en valeurs de 2000 à 2014.
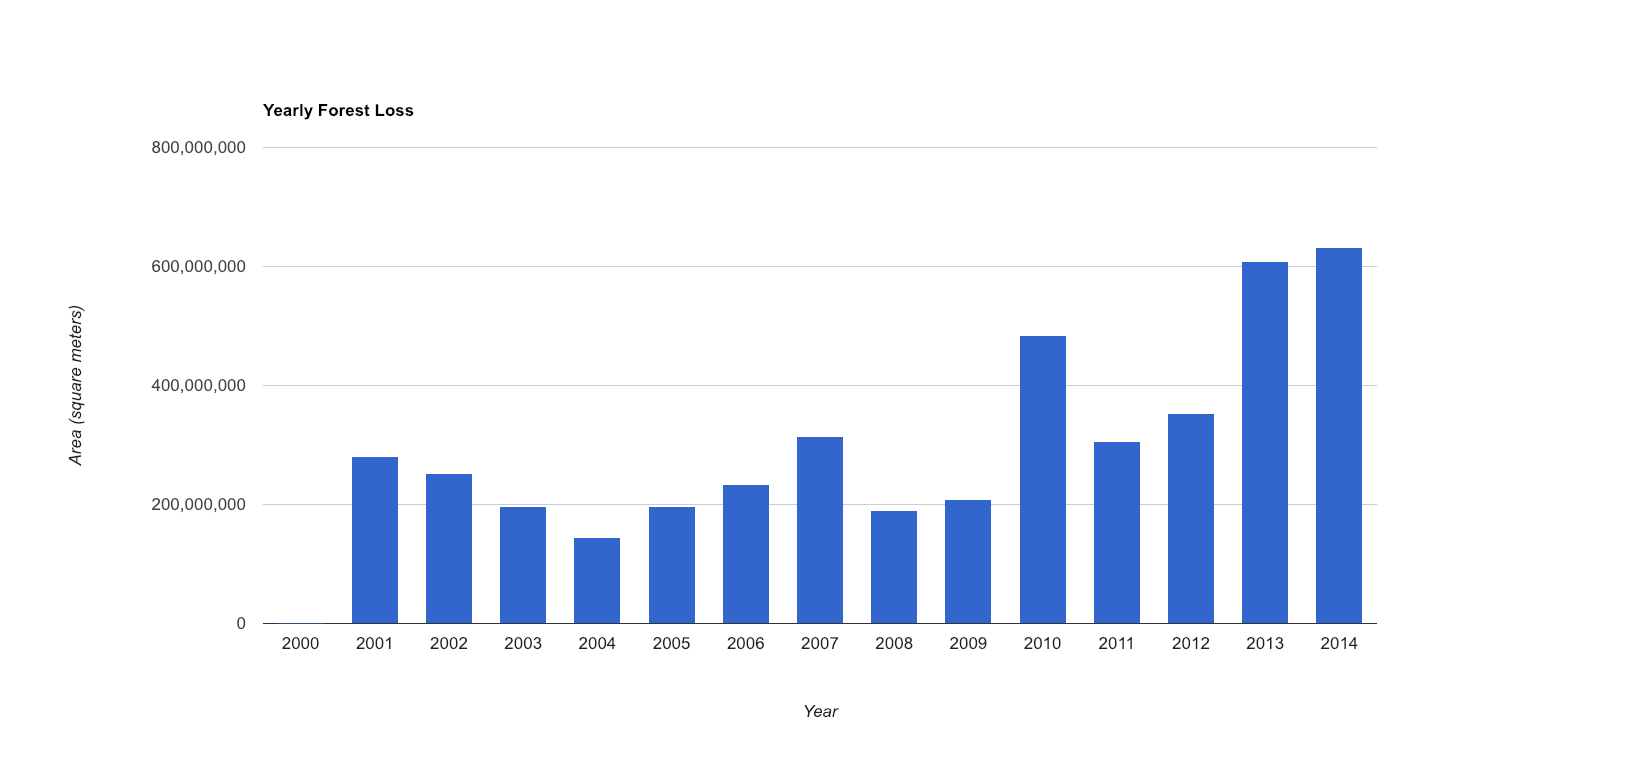
Maintenant que nous disposons des chiffres de pertes annuelles, nous pouvons préparer un graphique. Nous utiliserons la méthode ui.Chart.array.values(). Cette méthode prend un tableau (ou une liste) de valeurs d'entrée et un tableau (ou une liste) de libellés pour l'axe X.
Le résultat doit ressembler au graphique ci-dessous.
Figure 1. Graphique de la perte de forêt par an
Dans la section suivante, vous découvrirez un autre ensemble de données de surveillance de la déforestation, FORMA, et le comparerez aux données de Hansen et al.
Sauf indication contraire, le contenu de cette page est régi par une licence Creative Commons Attribution 4.0, et les échantillons de code sont régis par une licence Apache 2.0. Pour en savoir plus, consultez les Règles du site Google Developers. Java est une marque déposée d'Oracle et/ou de ses sociétés affiliées.
Dernière mise à jour le 2025/07/26 (UTC).
[null,null,["Dernière mise à jour le 2025/07/26 (UTC)."],[[["\u003cp\u003eThis tutorial demonstrates how to calculate yearly forest loss in a specific region using Google Earth Engine and grouped reducers.\u003c/p\u003e\n"],["\u003cp\u003eThe \u003ccode\u003elossYear\u003c/code\u003e band is used to categorize forest loss by year, ranging from 2000 to 2014.\u003c/p\u003e\n"],["\u003cp\u003eThe output is formatted into a dictionary where years are keys and corresponding loss areas are values.\u003c/p\u003e\n"],["\u003cp\u003eA column chart is generated to visualize yearly forest loss trends using the \u003ccode\u003eui.Chart.array.values()\u003c/code\u003e method.\u003c/p\u003e\n"],["\u003cp\u003eThe tutorial further directs users to explore and compare with other deforestation monitoring datasets.\u003c/p\u003e\n"]]],["The content demonstrates how to calculate yearly forest loss using Earth Engine. It involves adding a `lossYear` band to an image, then using a grouped reducer (`reduceRegion`) to sum pixel areas based on the year of loss (0-14). The output is formatted into a dictionary with years (2000-2014) as keys and loss areas as values. Finally, `ui.Chart.array.values()` is used to create a column chart visualizing the yearly forest loss, with years on the x-axis and loss area on the y-axis.\n"],null,["# Charting Yearly Forest Loss\n\nCalculating Yearly Forest Loss\n------------------------------\n\nIn the previous section you learned how to\n[calculate total forest area lost](/earth-engine/tutorials/tutorial_forest_03#calculating-pixel-areas) in\nthe given region of interest using the `reduceRegion` method. Instead of\ncalculating the total loss, it would be helpful to compute the loss for each year. The way\nto achieve this in Earth Engine is using a [Grouped Reducer](/earth-engine/guides/reducers_grouping).\n\n\nTo group output of `reduceRegion()`, you can specify a grouping band that\ndefines groups by integer pixel values. In the following example, we slightly modify the\nprevious code and add the `lossYear` band to the original image. Each pixel in the\n`lossYear` band contain values from 0 to 14 - indicating the year in which the\nloss occurred. We also change the reducer to a grouped reducer, specifying the band index of\nthe grouping band (1) so the pixel areas will be summed and grouped according to the value\nin the `lossYear` band.\n\n### Code Editor (JavaScript)\n\n```javascript\n// Load country boundaries from LSIB.\nvar countries = ee.FeatureCollection('USDOS/LSIB_SIMPLE/2017');\n// Get a feature collection with just the Congo feature.\nvar congo = countries.filter(ee.Filter.eq('country_co', 'CF'));\n\n// Get the loss image.\n// This dataset is updated yearly, so we get the latest version.\nvar gfc2017 = ee.Image('UMD/hansen/global_forest_change_2017_v1_5');\nvar lossImage = gfc2017.select(['loss']);\nvar lossAreaImage = lossImage.multiply(ee.Image.pixelArea());\n\nvar lossYear = gfc2017.select(['lossyear']);\nvar lossByYear = lossAreaImage.addBands(lossYear).reduceRegion({\n reducer: ee.Reducer.sum().group({\n groupField: 1\n }),\n geometry: congo,\n scale: 30,\n maxPixels: 1e9\n});\nprint(lossByYear);\n```\n\nOnce you run the above code, you will see the yearly forest loss area printed out in a nested\nlist called `groups`. We can format the output a little to make the result a\ndictionary, with year as the key and loss area as the value. Notice that we are using the\n`format()` method to convert the year values from 0-14 to 2000-2014.\n\n### Code Editor (JavaScript)\n\n```javascript\nvar statsFormatted = ee.List(lossByYear.get('groups'))\n .map(function(el) {\n var d = ee.Dictionary(el);\n return [ee.Number(d.get('group')).format(\"20%02d\"), d.get('sum')];\n });\nvar statsDictionary = ee.Dictionary(statsFormatted.flatten());\nprint(statsDictionary);\n```\n\nMaking a chart\n--------------\n\nNow that we have yearly loss numbers, we are ready to prepare a chart. We will use the\n`ui.Chart.array.values()` method. This method takes an array (or list) of input\nvalues and an array (or list) of labels for the X-axis.\n\n\n### Code Editor (JavaScript)\n\n```javascript\nvar chart = ui.Chart.array.values({\n array: statsDictionary.values(),\n axis: 0,\n xLabels: statsDictionary.keys()\n}).setChartType('ColumnChart')\n .setOptions({\n title: 'Yearly Forest Loss',\n hAxis: {title: 'Year', format: '####'},\n vAxis: {title: 'Area (square meters)'},\n legend: { position: \"none\" },\n lineWidth: 1,\n pointSize: 3\n });\nprint(chart);\n```\n\nThe result should look like the chart below.\nFigure 1. Chart of Forest Loss by Year\n\nIn the [next section](/earth-engine/tutorials/tutorial_forest_04),\nyou'll learn about another deforestation monitoring dataset,\n[FORMA](https://www.cgdev.org/sites/default/files/1423248_file_Hammer_Kraft_Wheeler_FORMA_FINAL.pdf),\nand compare it to the Hansen et al. data."]]