使用數據分析監控搜尋流量和其他更多資料
透過集合功能整理內容
你可以依據偏好儲存及分類內容。
2022 年 3 月 30 日,星期三
本文將說明如何使用數據分析為搜尋流量建立監控資訊主頁。Search Console 提供立即可用的圖表和篩選功能,而數據分析可讓您自訂專屬圖表,並與其他資料並排查看,例如 Google Ads、Analytics、YouTube、BigQuery 等。如果您錯過了這個系列先前的文章,請參閱將 Search Console 連結至數據分析一文。
在深入說明如何建立資訊主頁之前,我們想先與數據分析使用者分享一些好消息:從今天起,Search Console 連接器會納入探索和 Google 新聞流量資料,與最近新增至 API 的資料類似。
在這篇文章中,我們會提供一個資訊主頁供您使用,您可以輸入自己的資料,並輕鬆地切換不同的 Search Console 資源、資料類型和裝置等。您可以將相關資料連結至這個範本,監控自家網站的 Google 搜尋流量。
請繼續閱讀下文,進一步瞭解資訊主頁。
使用資訊主頁的建議方式和原因
建立資訊主頁時,建議您一律先從定義用途開始,大部分都屬於下列三個選項之一:
- 監控成效:迅速找出資料異動,例如監控網站上重要網頁的網址點擊次數和點閱率 (CTR)。
- 資料探索:從資料中取得深入分析資訊,例如分析不同國家/地區、裝置或網站版面的搜尋成效模式。
- 公開發布資訊:發布有趣的趨勢和模式,例如分享按產業區隔的匯總資料。
本文會說明監控成效資訊主頁,應該有助您即時找出問題。一般來說,這類資訊主頁會使用折線圖或長條圖等簡單的視覺化圖表和表格,方便快速解讀。如果發現問題,搜尋引擎最佳化 (SEO) 專家或分析人員可以進一步探索資料 (詳情請見下一篇文章)。
搜尋流量監控資訊主頁
如前文所述,這篇文章提供
範本讓您監控 Google 搜尋的成效。本節將討論如何將搜尋資料整合至數據分析、資訊主頁提供的功能和資料,以及我們做出一些設計決策的原因。
設定 Search Console 連接器
登入
數據分析,建立
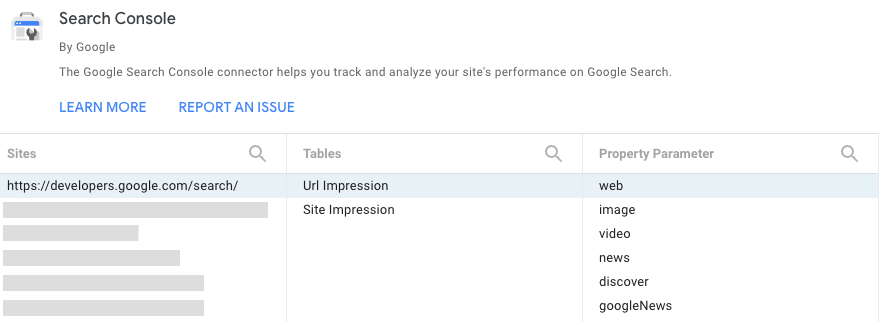
Search Console 資料來源,然後選擇「網址曝光」
表格,其中包含網址層級基礎上的網站、圖片、影片、新聞、探索和 googleNews 相關資料。您在這裡選擇的「資源參數」
將成為報表的預設參數,但您可以透過篩選器存取其他參數,詳情請參閱下文。如要進一步瞭解這些資料,請參閱
成效報表說明網頁。
使用篩選器和日期控管資料
報表標頭提供多個選項,可用來篩選圖表中的資料:
- 使用資料控管功能切換您有權存取的 Search Console 資源。
- 選擇要在報表中查看的日期範圍。根據預設,系統會顯示最近 28 天與再往前回推 28 天的比較資料。
- 建立篩選器以細查資料:
- 網頁:這個篩選器可用來納入或排除您網站中的一或多個網頁。提示:您可以使用規則運算式,方法與在 Search Console 中使用運算式類似。
- 類型:這個篩選器可用來選擇不同的資料類型,包括探索和 Google 新聞。一次只能選擇一個類型。
- 國家/地區:這個篩選器可用來納入或排除一或多個國家/地區。
- 裝置:這個篩選器可用來選擇一或多個裝置類別。
監控點擊次數和點閱率的長期變化
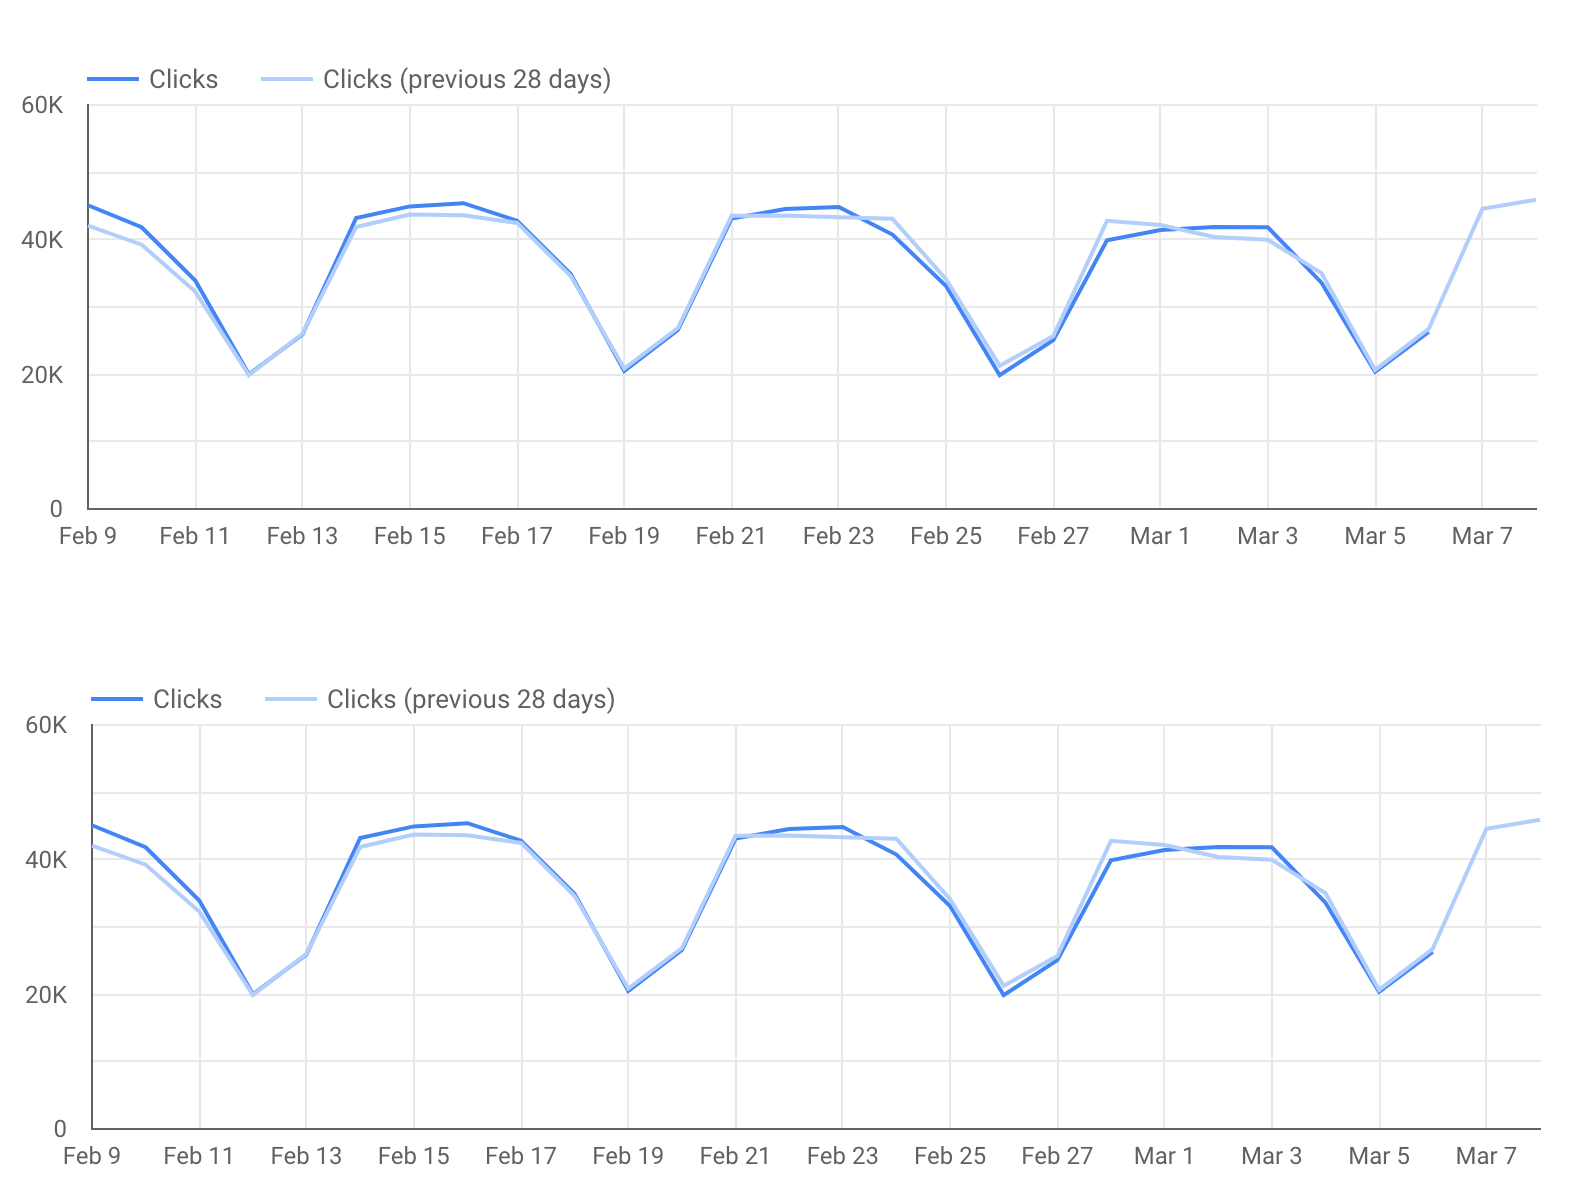
折線圖是最有效的視覺化工具,能夠清楚顯示指標的長期變化。在這個範例中,我們選擇同時查看「點擊次數」和「網站點閱率」。在折線圖中,您會看到週末和平日的模式截然不同 (這也是為什麼設定折線圖的日期範圍時,務必要使用 7 的倍數),請特別留意那些規律模式出現變化的日期!
請注意,這張圖片顯示的是工作導向網站的流量,流量在平日較高,在週末則較低。
這個模式可能和您的網站截然不同。
這份報表並未納入 Google Analytics 資料,但您可以考慮加入一張圖表,藉此顯示網站有多少轉換來自 Google 搜尋的自然流量。瞭解如何將 Google Analytics 連結到數據分析,這有助於取得詳細資訊。
細查特定網址或網站版面
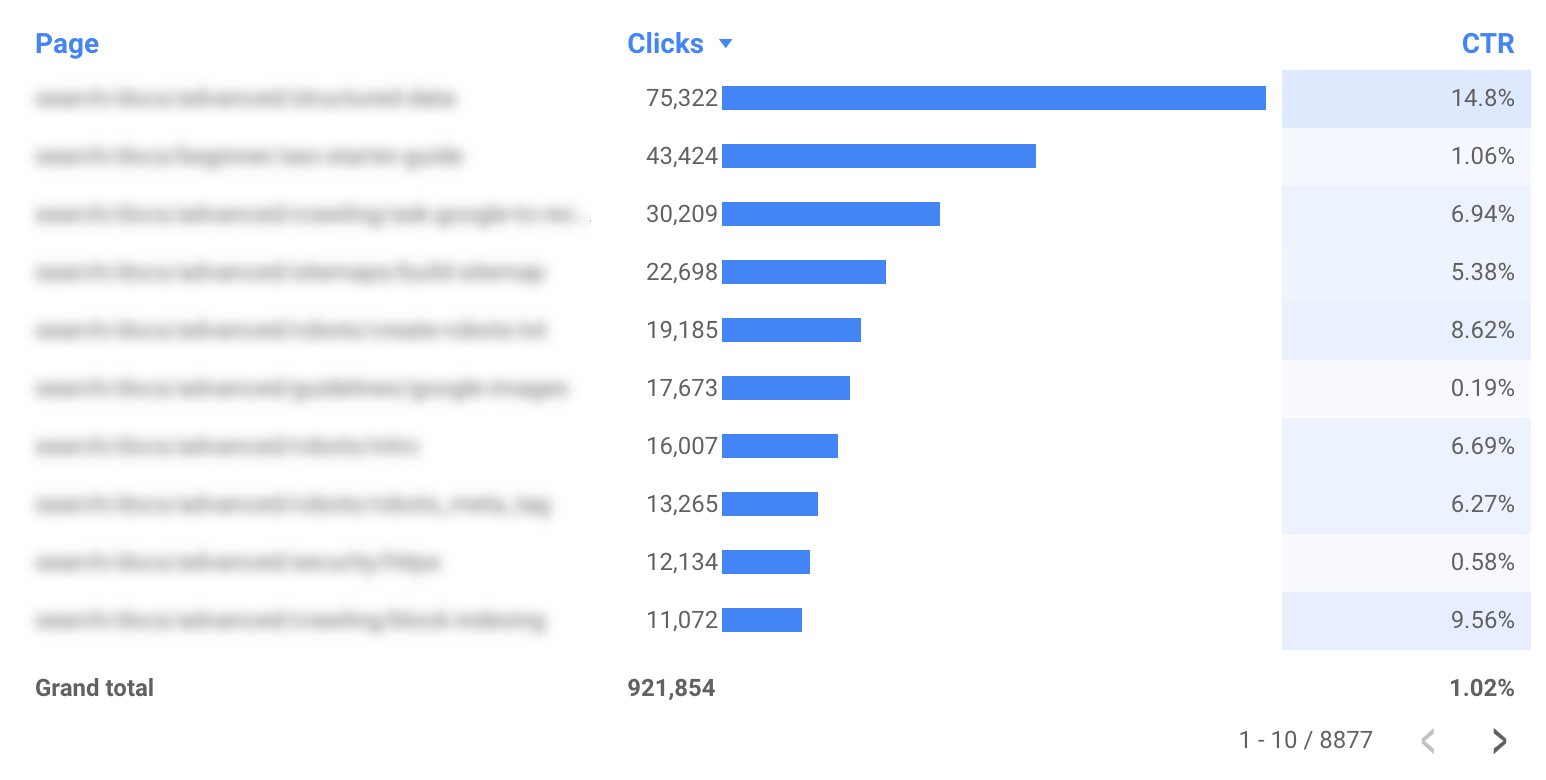
分析趨勢和模式時,圖表較為實用,但如果想更深入瞭解相關資訊,建議您使用表格來分析特定網址或一組網址。例如:
- 使用「網頁」篩選器,讓報表只顯示網站的特定版面。
- 使用「國家/地區」篩選器,即可查看不同網頁在指定國家/地區的成效。
- 使用「類型」篩選器來分析每種資料類型的網址層級成效。
其他實用提示
提示 #1:讓資訊主頁適合透過行動裝置瀏覽
大多數資訊主頁都不需要調整為適合透過行動裝置瀏覽,因為使用者會透過電腦存取。不過,如果在上下班通勤時經常需要監控資訊主頁的話,適合透過行動裝置瀏覽就很重要。
為了在監控資訊主頁中提供良好的行動裝置體驗,請將「報表和網頁版面配置」底下的「顯示模式」設為「符合寬度」,資訊主頁的寬度就會隨著螢幕大小自動調整。選擇這個選項後,請務必查看報表在不同螢幕大小上的效果。
提示 #2:縮短網址字串
如果報表包含單一網域 (不含子網域),建議您將網域名稱從報表中移除,讓表格更加簡潔。舉例來說,如果您要為 example.com/cool-dashboards/search
建立報表,則只會看到 /cool-dashboards/search
。如要這麼做,您可以使用以下規則運算式建立計算結果欄位,將網域名稱從網址中移除。
以 .com
網域名稱為例,您可以使用以下運算式:
REGEXP_EXTRACT(Landing Page, ".*\\.com/(.*)$")
下一步:最佳化搜尋作業的進階圖表
在下一篇文章「使用 Search Console 泡泡圖最佳化網站成效」中,我們將說明進階圖表,這可能有助您瞭解在進行最佳化搜尋作業時該聚焦於何處。
如有任何問題,歡迎隨時透過 Google 搜尋中心社群或數據分析社群提問。此外,如果您使用 Twitter,請務必追蹤我們,我們會在上面公告最新文章的相關資訊。
祝您使用資訊主頁愉快!
發文者:搜尋服務代表 Daniel Waisberg
除非另有註明,否則本頁面中的內容是採用創用 CC 姓名標示 4.0 授權,程式碼範例則為阿帕契 2.0 授權。詳情請參閱《Google Developers 網站政策》。Java 是 Oracle 和/或其關聯企業的註冊商標。
[null,null,[],[[["\u003cp\u003eThis article explains how to build a Data Studio dashboard to monitor website search traffic, including clicks, CTR, and performance by page, country, device, and search type.\u003c/p\u003e\n"],["\u003cp\u003eThe provided dashboard template allows users to connect their own Search Console data for analysis and visualization.\u003c/p\u003e\n"],["\u003cp\u003eThe dashboard focuses on monitoring performance, enabling users to quickly identify and address changes in search traffic patterns.\u003c/p\u003e\n"],["\u003cp\u003eData Studio's Search Console connector now includes Discover and Google News traffic data, enhancing the scope of analysis.\u003c/p\u003e\n"],["\u003cp\u003eThe article also offers tips on making the dashboard mobile-friendly and shortening URL strings for improved readability.\u003c/p\u003e\n"]]],["This article details creating a Google Search traffic monitoring dashboard in Data Studio. It explains how to use a provided template to track Search Console data, including web, image, video, news, Discover, and Google News traffic. Key actions include setting up a Search Console connector, using filters (page, type, country, device), and analyzing clicks and click-through rates (CTR) over time via line charts. It also emphasizes mobile-friendly design and URL shortening tips. The core function of this dashboard is to monitor performance for quick issue detection.\n"],null,["# Monitoring Search traffic (and more!) with Data Studio\n\nWednesday, March 30, 2022\n\n\nThis article shows how to create a monitoring dashboard for your Search traffic on Data Studio. While Search Console provides\nout-of-the-box charts and filtering capabilities, Data Studio allows you to customize your own charts and view them side\nby side with other data, such as Google Ads, Analytics, YouTube, BigQuery, and others. If you missed our previous article\nin this series, check it out at [Connecting Search Console to Data Studio](/search/blog/2022/03/connecting-data-studio).\n\n\nBefore we dive into dashboarding, we have some good news for Data Studio users: *as of today, the Search Console connector includes\ndata for Discover and Google News traffic, similar to the data [recently\nadded](/search/blog/2021/10/search-analytics-discover-gnews) to the API*.\n\n\nIn today's post, we're sharing a dashboard for you to use with your own data; it makes it easy to toggle between different Search Console properties,\ndata types, devices, and more. You can link your own data to\n[this template](https://datastudio.google.com/reporting/7300a2df-97a2-408a-b10c-43acd2270fe6/page/6zXD/preview) to monitor\nyour site's Google Search traffic.\n\n\nKeep reading to learn more about the dashboard.\n\nHow and why you should use a dashboard\n--------------------------------------\n\n\nWhen you build a dashboard, you should always start by defining its purpose,\nand the majority of cases can be classified as one of three options:\n\n- **Monitoring performance**. Quickly discover a change in the data, for example monitoring URL clicks and click-through rate (CTR) for important pages on your site.\n- **Data exploration**. Uncover insights from data, for example analyzing search performance patterns across different countries, devices, or website sections.\n- **Informing the world**. Publishing interesting trends and patterns, for example sharing aggregate data segmented by industry.\n\n\nToday we'll discuss a monitoring performance dashboard, which should help you find out issues as they happen. Usually, this kind\nof dashboard uses simple visualizations such as line or bar charts, and tables --- those are quick to interpret. Then, if an issue\nis discovered, the SEO or analyst can proceed to a deeper data exploration (this will be covered in the next post).\n\nSearch traffic monitoring dashboard\n-----------------------------------\n\nAs mentioned, this post provides [a template](https://datastudio.google.com/reporting/7300a2df-97a2-408a-b10c-43acd2270fe6/page/6zXD/preview) to monitor Google Search performance. In this section, we discuss how to get your Search data into Data Studio, what functionality and data the dashboard provides, and why we made some of the design decisions.\n\n### Set up a Search Console connector\n\nSign in to [Data Studio](https://datastudio.google.com/), create a [Search Console data source](https://support.google.com/datastudio/answer/7314895), and choose the **URL Impression** table, which includes data for web, image, video, news, discover, and googleNews on a URL level basis. The **Property Parameter** you choose here will be the default one in your report, but you'll have access to the others through a filter, more about it later in the post. To learn more about the data visit the [Performance report help pages](https://support.google.com/webmasters/topic/9384513).\n\n\n### Control the data using filters and dates\n\n\nThe header of the report includes several options for you to filter the data in the charts:\n\n1. Use the [data control](https://support.google.com/datastudio/answer/7415591) to change between the Search Console properties you have access to.\n2. Choose the date range you'd like to see in the report. By default you'll see the last 28 days compared to the previous 28 days.\n3. Create filters to drill down on your data:\n - **Page** . Use this to include or exclude one or more pages from your website. Tip: you can [use regular expressions](/search/blog/2021/06/regex-negative-match) similar to the way you use it in Search Console.\n - **Type**. Use this to choose among the different data types (including Discover and Google News). You can only choose one at a time.\n - **Country**. Use this to include or exclude one or more countries.\n - **Device**. Use this to choose one or more device categories.\n\n\n### Monitor clicks and CTR over time\n\n\nA line chart is the most effective visualization to show how metrics change over time. In this case, we chose to look at both\nClicks and Site CTR. In the line chart image, weekends and weekdays have very different patterns (one of the reasons it's\nimportant to always use a multiple of 7 in your line charts date range) --- *keep your eyes on days that break that pattern!*\n\n\nNote that this image is for a website that is work oriented, hence the traffic is high on weekdays and low on weekends.\nIt might look very different for your site.\n\n\nWe have not included Google Analytics data in this report, but it might be interesting to include a chart showing how many conversions the\nwebsite got from organic Google Search. Learn how to [connect\nGoogle Analytics](https://support.google.com/datastudio/answer/6370352) to Data Studio; this would help closing the loop.\n\n### Drill down into specific URLs (or website sections)\n\n\nWhen you analyze trends and patterns, charts will be more helpful to you, but if you want to go deeper, it's more effective to analyze particular\nURLs (or groups of them) using a table. For example:\n\n- Use the page filter to include only specific sections of your website.\n- Use the country filter to check how different pages perform in countries you care about.\n- Use the type filter to analyze URL-level performance for each of the data types.\n\n\nBonus tips\n----------\n\n### Tip #1: Make your dashboard mobile-friendly\n\n\nMost dashboards don't need to be mobile friendly as people use them on their computer. But a monitoring dashboard can be often\nused while commuting to work, so it might be important for it to be mobile-friendly.\n\n\nIn order to create a good mobile experience for a monitoring dashboard, set \"Display mode\" to \"Fit to width\" (found under\n[report and page layout](https://support.google.com/datastudio/answer/7355651)) --- this will adjust the\ndashboard width to the screen size. If you choose this option, make sure to check how the report looks on different screen sizes.\n\n### Tip #2: Shorten URL strings\n\n\nIf your report includes a single domain with no subdomains, you might consider removing the domain name from your report\nto make the tables less cluttered. For example, if you're building a report for `example.com/cool-dashboards/search`,\nyou'd see only `/cool-dashboards/search`. To do so, you can create a\n[calculated field](https://support.google.com/datastudio/answer/6299685) to remove the domain name\nfrom the URL using a regular expression. For example, for a `.com` domain name you\ncould use the following expression: \n\n```scdoc\nREGEXP_EXTRACT(Landing Page, \".*\\\\.com/(.*)$\")\n```\n\nNext: An advanced chart for optimizing your Search efforts\n----------------------------------------------------------\n\n\nIn the next post, [Optimizing website performance with a Search Console bubble chart](/search/blog/2022/04/performance-optimization-bubble-chart), we'll discuss an advanced chart that may help you understand where to focus your attention when it comes to\noptimizing your Search efforts.\n\n\nAs always, let us know if you have any questions through the [Google\nSearch Central Community](https://support.google.com/webmasters/threads?thread_filter=(category:search_console)) or the [Data\nStudio Community](https://support.google.com/datastudio/threads?thread_filter=(category:connect_to_data)). Also, if you're on Twitter, make sure to [follow us](https://twitter.com/googlesearchc);\nwe'll announce future posts over there.\n\n\n*Happy dashboarding!*\n\nPosted by [Daniel Waisberg](https://www.danielwaisberg.com), Search Advocate"]]