เราอยู่ใน LinkedIn แล้วตอนนี้: หากต้องการข่าวสารและแหล่งข้อมูลจาก Google Search เกี่ยวกับการทำให้เว็บไซต์ของคุณค้นพบได้ โปรด
ติดตามเราใน LinkedIn
การเพิ่มประสิทธิภาพเว็บไซต์ด้วยแผนภูมิฟองอากาศของ Search Console
จัดทุกอย่างให้เป็นระเบียบอยู่เสมอด้วยคอลเล็กชัน
บันทึกและจัดหมวดหมู่เนื้อหาตามค่ากำหนดของคุณ
วันพุธที่ 6 เมษายน 2022
การวิเคราะห์ข้อมูลประสิทธิภาพใน Search นั้นเป็นเรื่องที่ท้าทาย แต่จะยิ่งท้าทายขึ้นเมื่อคุณมีคำค้นหาเฉพาะเจาะจงจำนวนมากซึ่งมองเห็นภาพและเข้าใจได้ยาก ในโพสต์นี้ เราเผยเคล็ดลับที่จะช่วยให้คุณค้นพบโอกาสในการเพิ่มประสิทธิภาพใน Google Search ของเว็บไซต์
หากคุณยังไม่ได้อ่านโพสต์ล่าสุดเรื่องการเชื่อมต่อ Search Console กับ Data Studio และการตรวจสอบการเข้าชมจาก Search ด้วย Data Studio ให้ลองอ่านเพื่อทำความเข้าใจถึงสิ่งที่คุณสามารถทำโดยใช้ Search Console ใน Data Studio
วันนี้เราจะพูดถึงแผนภูมิฟองอากาศ ซึ่งช่วยให้คุณเข้าใจว่าคำค้นหาใดทำงานได้ดีสำหรับเว็บไซต์และคำค้นหาใดควรปรับปรุง ก่อนอื่นเราจะอธิบายองค์ประกอบหลักในแผนภูมิ โดยพูดถึงการตั้งค่าที่เจาะจงและอิทธิพลที่มีต่อข้อมูล จากนั้นก็จะแนะนำสิ่งที่ควรมองหาเมื่อวิเคราะห์ข้อมูล
เริ่มจากข่าวดี นั่นคือ คุณไม่จำเป็นต้องสร้างแผนภูมิใหม่ตั้งแต่ต้น ให้ใช้เทมเพลตนี้ เชื่อมต่อข้อมูล และปรับแต่งการตั้งค่าที่ต้องการ
มาเริ่มกันเลย...
การทำความเข้าใจแผนภูมิ
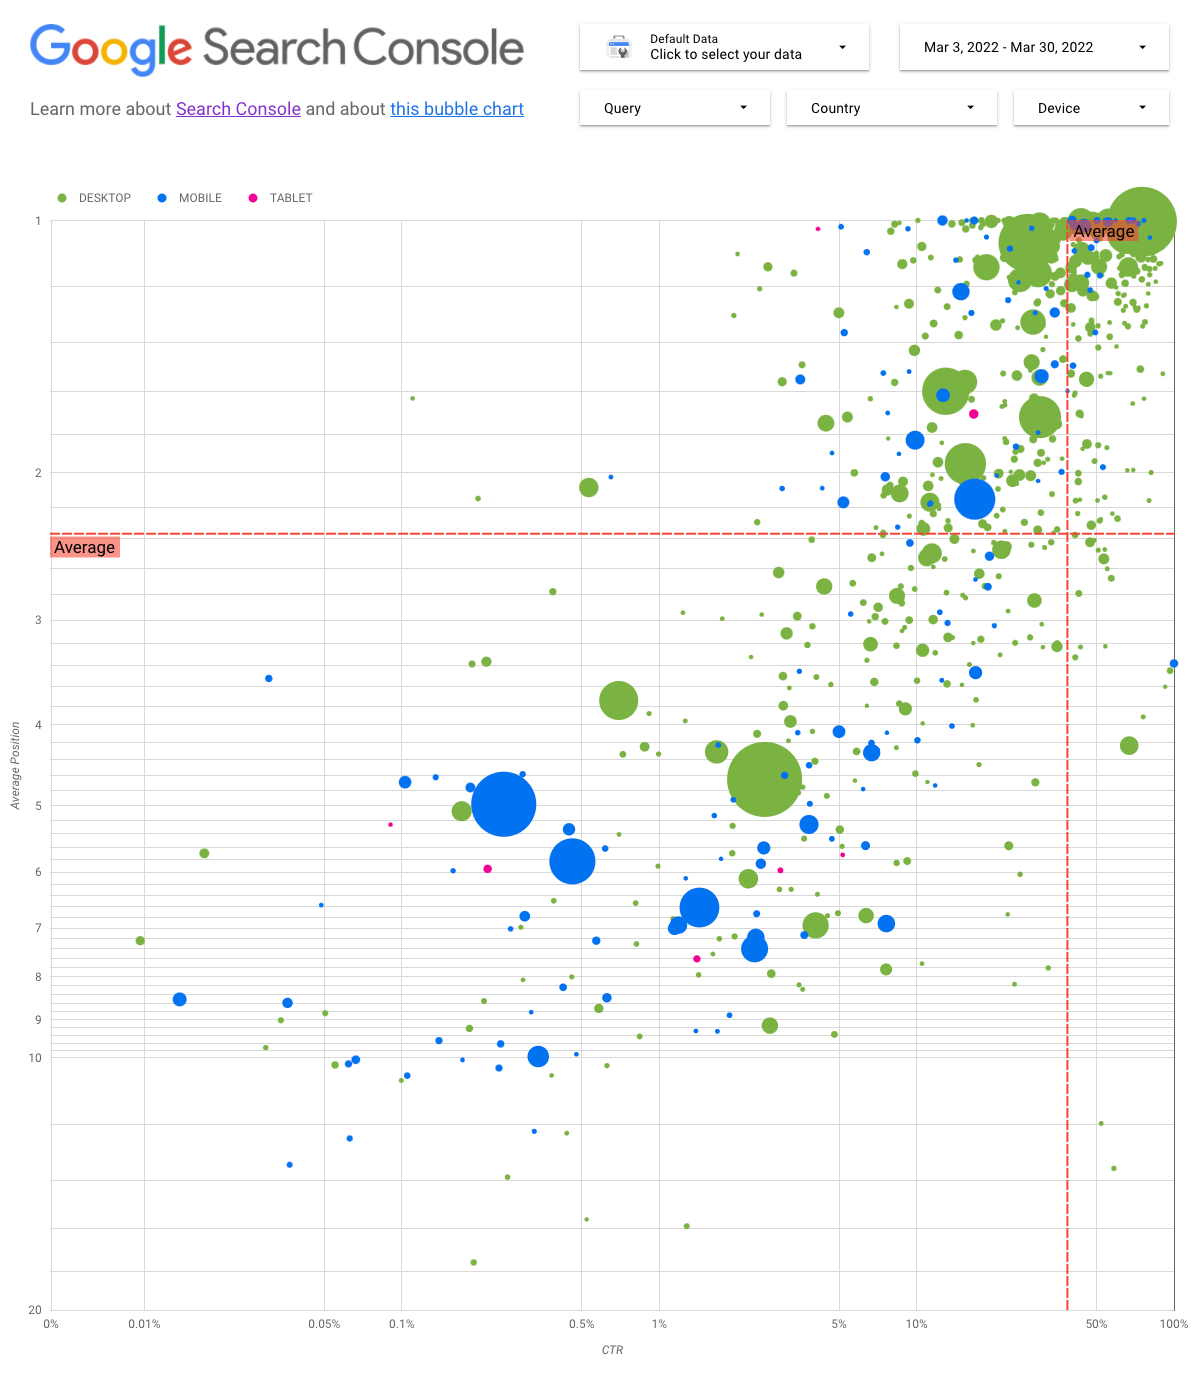
แผนภูมิฟองอากาศเป็นการแสดงภาพที่ยอดเยี่ยมเมื่อคุณมีเมตริกและมิติข้อมูลหลายรายการ เนื่องจากช่วยให้ดูความสัมพันธ์และรูปแบบในข้อมูลได้อย่างมีประสิทธิภาพมากขึ้น ในตัวอย่างที่แสดงอยู่นี้ คุณจะเห็นแอตทริบิวต์การเข้าชม (อัตราการคลิกผ่าน (CTR), อันดับเฉลี่ย) และปริมาณ (การคลิกทั้งหมด) ของมิติข้อมูลต่างๆ (คำค้นหา อุปกรณ์) พร้อมกัน
เราจะอธิบายองค์ประกอบบางอย่างของแผนภูมิเพื่อชี้แจงสิ่งที่แผนภูมิแสดงและไม่ได้แสดง
แหล่งข้อมูล
สำหรับแผนภูมินี้ เราใช้ตารางการแสดงผลในเว็บไซต์ที่ใช้งานได้ผ่านแหล่งข้อมูล Search Console ซึ่งมีข้อมูลประสิทธิภาพใน Search ที่รวบรวมไว้โดยแบ่งตามเว็บไซต์และคำค้นหา
ตัวกรองและการควบคุมข้อมูล
เราได้เพิ่มตัวเลือกการปรับแต่ง 5 รายการต่อไปนี้ในแผนภูมิเพื่อให้คุณควบคุมข้อมูลได้อย่างมีประสิทธิภาพ
- การควบคุมข้อมูล: เลือกพร็อพเพอร์ตี้ Search Console ที่ต้องการวิเคราะห์
- ช่วงวันที่: เลือกช่วงวันที่ที่ต้องการดูในรายงาน คุณจะเห็นข้อมูลในช่วง 28 วันที่ผ่านมาโดยค่าเริ่มต้น
- คำค้นหา: รวมหรือยกเว้นคำค้นหาที่ต้องการมุ่งเน้น คุณสามารถใช้นิพจน์ทั่วไปได้เช่นเดียวกับที่ใช้ใน Search Console
- ประเทศ: รวมหรือยกเว้นประเทศ
- อุปกรณ์: รวมหรือยกเว้นหมวดหมู่อุปกรณ์
แกน
แกนในแผนภูมิคืออันดับเฉลี่ย (แกน Y) และ CTR ของเว็บไซต์ (แกน X) แต่เราได้ทำการเปลี่ยนที่สำคัญ 3 อย่างต่อไปนี้เพื่อให้แผนภูมิมีข้อมูลเชิงลึกมากขึ้น
- กลับทิศทางของแกน Y: เนื่องจากแกน Y แสดงอันดับเฉลี่ย การกลับทิศทางจึงทำให้เลข 1 อยู่ด้านบน
สำหรับแผนภูมิธุรกิจส่วนใหญ่ ตำแหน่งที่ดีที่สุดจะอยู่ในมุมขวาบน การกลับทิศทางของแกน Y จึงทำให้ดูได้ง่ายขึ้นเมื่อใช้แสดงอันดับเฉลี่ย
- สเกล Log: สเกลลอการิทึมคือ "วิธีแสดงข้อมูลตัวเลขซึ่งมีช่วงค่ากว้างมากในลักษณะที่กระชับ (...) การเลื่อนหน่วยระยะทางไปตามสเกลหมายถึงมีการคูณตัวเลขนั้นด้วย 10" การใช้สเกล Log สำหรับทั้ง 2 แกนช่วยให้คุณเข้าใจคำค้นหาซึ่งอยู่ที่ปลายสุดของแผนภูมิ (CTR หรืออันดับเฉลี่ยที่ต่ำมาก หรือทั้งสองอย่าง) ได้ดีขึ้น
- เส้นอ้างอิง: เส้นอ้างอิงมีประโยชน์อย่างยิ่งในการไฮไลต์ค่าที่สูงหรือต่ำกว่าเกณฑ์หนึ่งๆ การดูค่าเฉลี่ย ค่ามัธยฐาน หรือเปอร์เซ็นไทล์หนึ่งๆ จะช่วยให้เห็นค่าที่เบี่ยงเบนไปจากรูปแบบได้ชัดเจน
ฟองอากาศ
ฟองอากาศแต่ละลูกในแผนภูมิแสดงคำค้นหา 1 รายการ เราใช้คุณสมบัติของรูปแบบ 2 รายการต่อไปนี้เพื่อให้แผนภูมิมีประโยชน์มากขึ้น
- ขนาด: การแสดงจำนวนคลิกโดยใช้ขนาดฟองอากาศช่วยให้คุณเห็นได้อย่างรวดเร็วว่าคำค้นหาใดกระตุ้นการเข้าชมจำนวนมาก ยิ่งฟองอากาศมีขนาดใหญ่ก็แสดงว่าคำค้นหาสร้างการเข้าชมได้มาก
- สี: การแสดงหมวดหมู่อุปกรณ์โดยใช้สีฟองอากาศช่วยให้คุณทราบความแตกต่างระหว่างประสิทธิภาพใน Search บนอุปกรณ์เคลื่อนที่กับเดสก์ท็อป คุณใช้สีแทนมิติข้อมูลใดก็ได้ แต่เมื่อมีหลายค่ามากขึ้น ก็จะทำให้เห็นรูปแบบไม่ชัดเจน
การวิเคราะห์ข้อมูล
เป้าหมายของการแสดงภาพนี้คือช่วยให้เห็นโอกาสในการเพิ่มประสิทธิภาพการค้นหา แผนภูมิประเภทนี้แสดงประสิทธิภาพของคำค้นหา โดยแกน Y แสดงอันดับเฉลี่ย แกน X แสดง CTR ขนาดฟองอากาศแสดงจำนวนการคลิกทั้งหมด และสีฟองอากาศแสดงหมวดหมู่อุปกรณ์
เส้นอ้างอิงสีแดงแสดงค่าเฉลี่ยของแต่ละแกน ซึ่งแยกแผนภูมิออกเป็น 4 ส่วนที่แทนประสิทธิภาพ 4 ประเภทของคำค้นหา ส่วนเหล่านี้ในแผนภูมิของคุณอาจดูแตกต่างจากที่แชร์ในโพสต์นี้ เนื่องจากจะขึ้นอยู่กับลักษณะการกระจายการค้นหาของเว็บไซต์
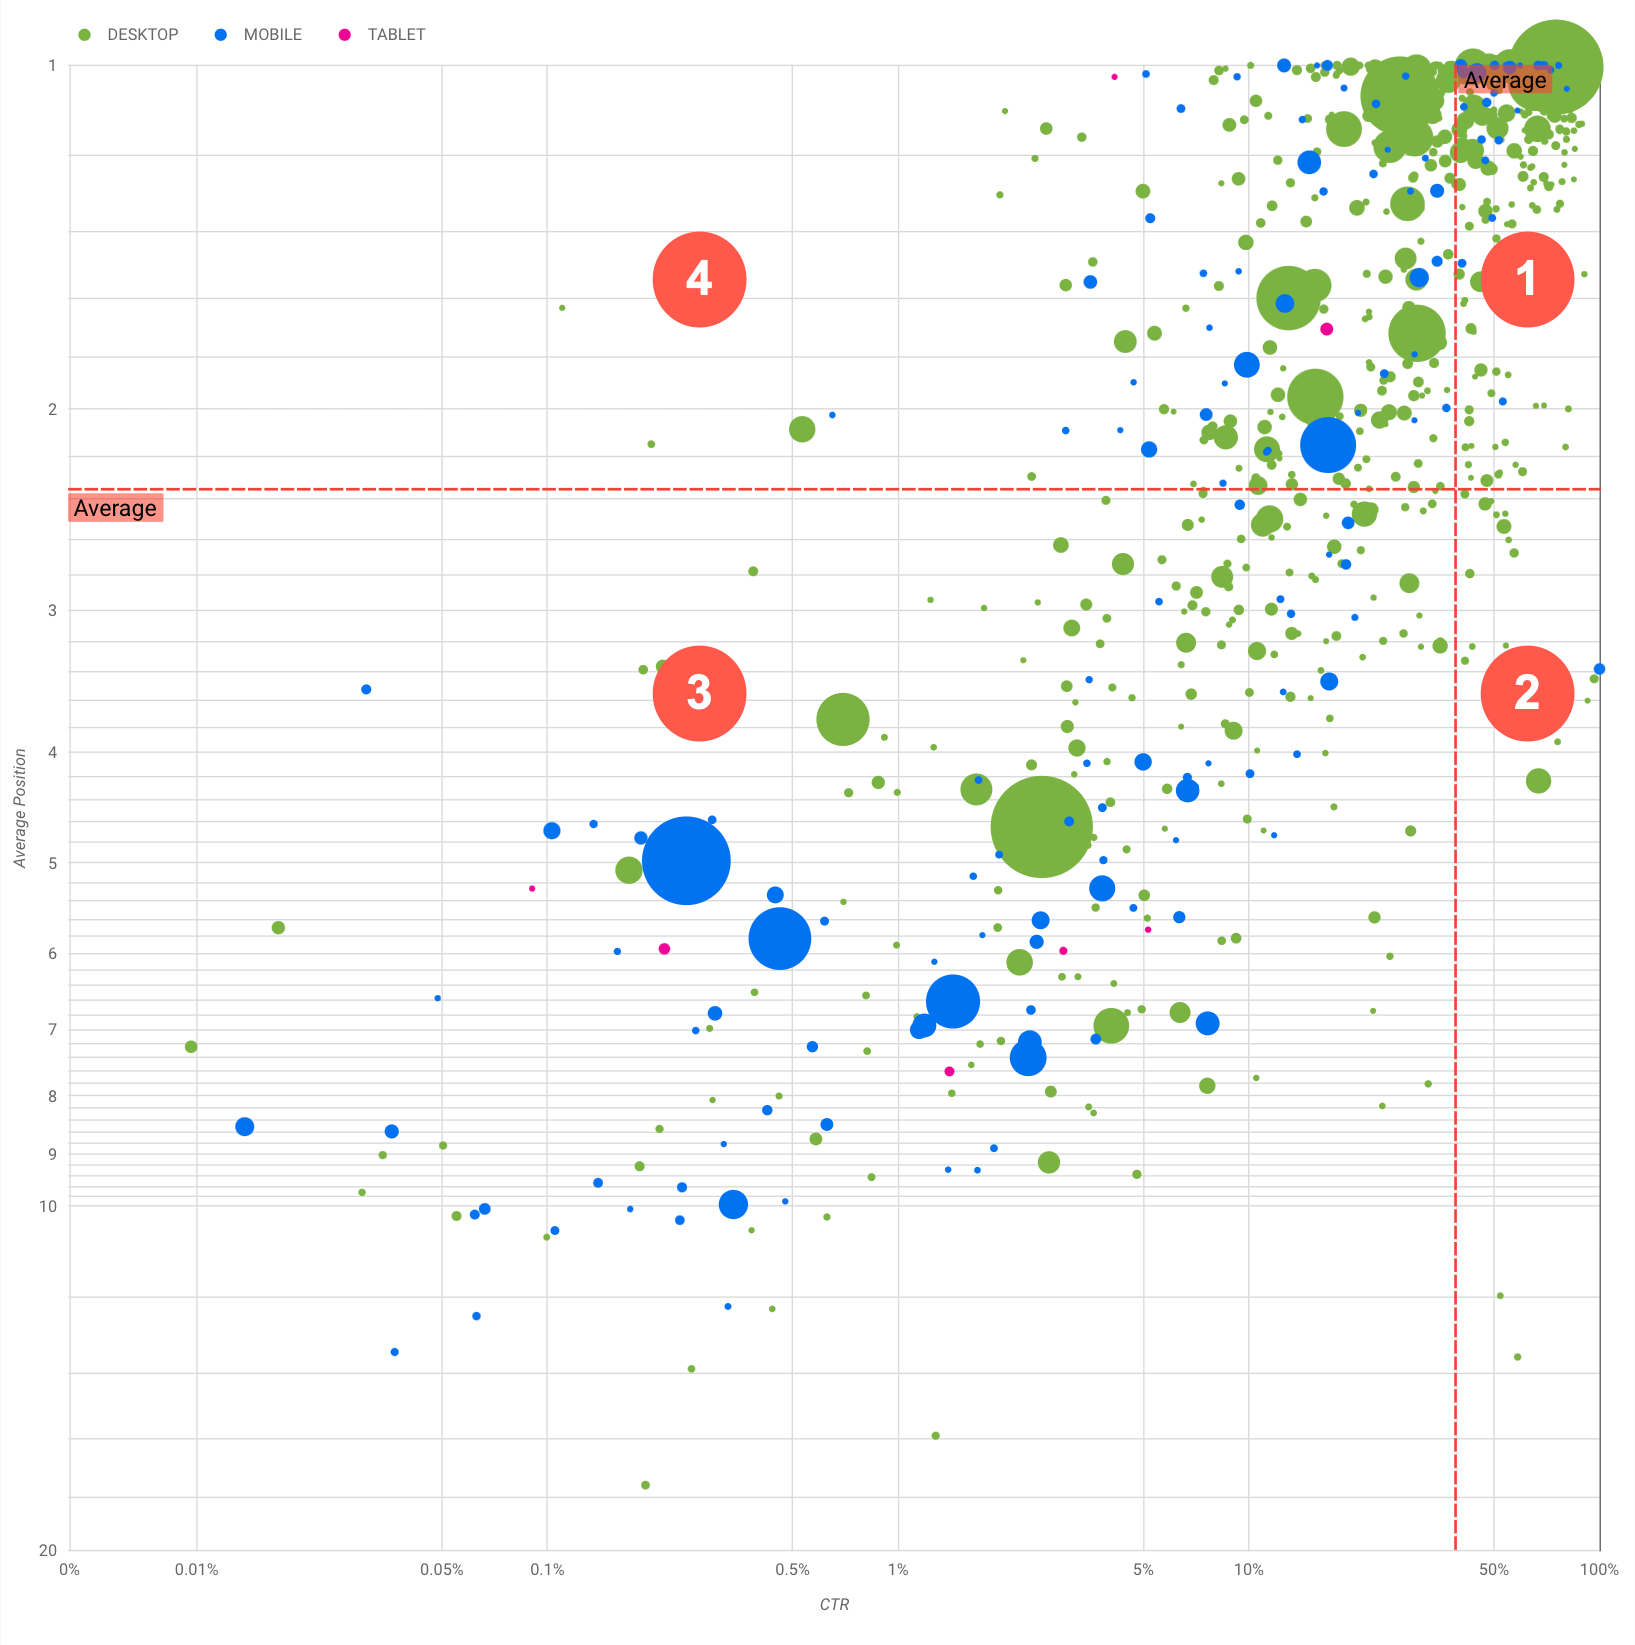
โดยทั่วไป แผนภูมิจะแสดงกลุ่ม 4 กลุ่มที่คุณสามารถวิเคราะห์เพื่อช่วยให้ตัดสินใจได้ว่าควรมุ่งเน้นเรื่องใดเมื่อเพิ่มประสิทธิภาพของคำค้นหา
- อันดับสูงสุด, CTR สูง: คุณไม่จำเป็นต้องดำเนินการใดมากนักเนื่องจากประสิทธิภาพดีมากอยู่แล้ว
- อันดับต่ำ, CTR สูง: ดูเหมือนว่าคำค้นหาเกี่ยวข้องกับผู้ใช้ คำค้นหาเหล่านี้ได้รับ CTR สูงแม้ว่าจะอยู่ในอันดับต่ำกว่าคำค้นหาโดยเฉลี่ยในเว็บไซต์ และอาจแสดงถึงการมีส่วนร่วมที่สำคัญหากอันดับสูงขึ้น ดังนั้นให้เน้นเพิ่มประสิทธิภาพคำค้นหาเหล่านี้
- อันดับต่ำ, CTR ต่ำ: เมื่อดูคำค้นหาที่มี CTR ต่ำ (หัวข้อนี้ย่อยและหัวข้อย่อยถัดไป) คุณควรดูที่ขนาดของฟองอากาศเพื่อให้ทราบว่าคำค้นหาใดมี CTR ต่ำแต่ยังคงกระตุ้นการเข้าชมที่สำคัญอยู่ แม้ว่าคำค้นหาในส่วนนี้อาจดูเหมือนจะไม่คุ้มกับความพยายามเพิ่มประสิทธิภาพ แต่ก็แบ่งออกได้เป็น 2 กลุ่มหลักๆ ได้แก่
- คำค้นหาที่เกี่ยวข้อง: หากคำค้นหานี้สำคัญกับคุณ การปรากฏใน Search อยู่แล้วเป็นจุดเริ่มต้นที่ดี
จัดลําดับความสำคัญของคำค้นหาเหล่านี้ก่อนคำค้นหาที่ไม่ปรากฏในผลการค้นหาเลย เนื่องจากจะเพิ่มประสิทธิภาพได้ง่ายกว่า
- การค้นหาที่ไม่เกี่ยวข้อง: หากคำค้นหาไม่เกี่ยวข้องกับเว็บไซต์ ก็อาจเป็นโอกาสที่ดีที่คุณจะปรับเนื้อหาให้มุ่งเน้นคำค้นหาที่จะสร้างการเข้าชมที่เกี่ยวข้อง
- อันดับสูงสุด, CTR ต่ำ: คำค้นหานี้อาจมี CTR ต่ำด้วยเหตุผลหลายประการ คุณควรตรวจสอบฟองอากาศที่ใหญ่ที่สุดเพื่อหาสัญญาณต่อไปนี้
- คู่แข่งอาจมีมาร์กอัป Structured Data ซึ่งแสดงพร้อมกับผลการค้นหาที่เป็นริชมีเดีย ซึ่งอาจดึงดูดให้ผู้ใช้คลิกผลการค้นหานั้นแทนที่จะเป็นผลการค้นหาของคุณ ลองเปิดใช้ฟีเจอร์ผลการค้นหาของ Search ในเว็บไซต์ของคุณ
- คุณอาจได้เพิ่มประสิทธิภาพหรือมีการจัดอันดับ "โดยไม่ตั้งใจ" สำหรับคำค้นหาที่ผู้ใช้ไม่สนใจซึ่งเกี่ยวข้องกับเว็บไซต์ของคุณ
- ผู้ใช้อาจพบข้อมูลที่ต้องการแล้ว เช่น เวลาทำการ ที่อยู่ หรือหมายเลขโทรศัพท์ของบริษัท
เมื่อพบคำค้นหาที่คุ้มค่ากับเวลาและความพยายามแล้ว อย่าลืมเพิ่มประสิทธิภาพโดยศึกษาจากคู่มือ SEO สำหรับมือใหม่ มาดูเคล็ดลับบางส่วนกัน
- ตรวจสอบว่าองค์ประกอบ
title
, แท็ก meta
คำอธิบาย และแอตทริบิวต์ alt
นั้นสื่อความหมาย มีความเจาะจง และถูกต้อง
- ใช้องค์ประกอบส่วนหัวเพื่อเน้นข้อความสำคัญและช่วยให้เนื้อหามีโครงสร้างตามลำดับชั้น เพื่อให้ผู้ใช้และเครื่องมือค้นหาไปยังส่วนต่างๆ ในเอกสารได้ง่ายขึ้น
- เพิ่มมาร์กอัป Structured Data เพื่ออธิบายเนื้อหาให้เครื่องมือค้นหาเข้าใจและมีสิทธิ์แสดงเนื้อหาในลักษณะที่เป็นประโยชน์ (และสะดุดตา) ในผลการค้นหา
- ลองนึกถึงคำต่างๆ ที่ผู้ใช้อาจใช้ค้นหาเนื้อหาของคุณ ขอแนะนำให้ใช้เครื่องมือวางแผนคีย์เวิร์ดของ Google Ads เพื่อช่วยค้นหาคีย์เวิร์ดรูปแบบใหม่ๆ และดูปริมาณการค้นหาโดยประมาณของคีย์เวิร์ดแต่ละรายการ คุณยังใช้ Google เทรนด์เพื่อหาไอเดียจากหัวข้อที่กําลังเป็นที่นิยมและคำค้นหาที่เกี่ยวข้องกับเว็บไซต์ของคุณได้อีกด้วย
ความคิดเห็น
และเช่นเคย หากมีข้อสงสัยใดๆ โปรดแจ้งให้เราทราบผ่านชุมชน Google Search Central หรือชุมชน Data Studio
นอกจากนี้ หากคุณใช้ Twitter อย่าลืมติดตามเรา เพราะเราจะแจ้งให้ทราบเมื่อมีโพสต์ใหม่ๆ ผ่านช่องทางนี้
โพสต์โดย Daniel Waisberg ผู้ประสานงานของ Search
เนื้อหาของหน้าเว็บนี้ได้รับอนุญาตภายใต้ใบอนุญาตที่ต้องระบุที่มาของครีเอทีฟคอมมอนส์ 4.0 และตัวอย่างโค้ดได้รับอนุญาตภายใต้ใบอนุญาต Apache 2.0 เว้นแต่จะระบุไว้เป็นอย่างอื่น โปรดดูรายละเอียดที่นโยบายเว็บไซต์ Google Developers Java เป็นเครื่องหมายการค้าจดทะเบียนของ Oracle และ/หรือบริษัทในเครือ
[null,null,[],[[["\u003cp\u003eThis blog post provides tips and techniques using a bubble chart in Data Studio to analyze website search performance and identify optimization opportunities.\u003c/p\u003e\n"],["\u003cp\u003eThe bubble chart visualizes query performance by showing average position, click-through rate, total clicks (bubble size), and device category (bubble color).\u003c/p\u003e\n"],["\u003cp\u003eThe chart helps identify four types of queries: top-performing, high-CTR but low-ranking, low-CTR and low-ranking, and high-ranking but low-CTR, offering optimization strategies for each.\u003c/p\u003e\n"],["\u003cp\u003eOptimization tips include improving title tags, meta descriptions, headings, structured data, and keyword research using tools like Keyword Planner and Google Trends.\u003c/p\u003e\n"],["\u003cp\u003eUsers can leverage a provided Data Studio template to connect to their Search Console data and customize the analysis according to their needs.\u003c/p\u003e\n"]]],["This blog post explains how to use a bubble chart to analyze Google Search performance data. The chart visualizes query performance, with average position on the y-axis, CTR on the x-axis, click volume as bubble size, and device category as bubble color. Users can customize the data with filters like date range, query, country, and device. The chart identifies four query performance groups to target for optimization: high or low position and CTR. Optimization tips include improving titles, descriptions, structured data, and keyword research.\n"],null,["# Optimizing website performance with a Search Console bubble chart\n\nWednesday, April 06, 2022\n| It's been a while since we published this blog post. Some of the information may be outdated (for example, some images may be missing, and some links may not work anymore). Check out the new documentation on [improving SEO with a Search Console bubble chart](/search/docs/monitor-debug/bubble-chart-analysis).\n\n\nAnalyzing Search performance data is always a challenge, but even more so when you have plenty of long-tail queries,\nwhich are harder to visualize and understand. In this post, we'll provide tips to help you uncover opportunities to\noptimize your site's Google Search performance.\n\n\nIf you haven't read our recent posts on [connecting Search Console to Data Studio](/search/blog/2022/03/connecting-data-studio)\nand [monitoring Search traffic with Data Studio](/search/blog/2022/03/monitoring-dashboard),\nconsider checking them out to understand more about what you can do with Search Console in Data Studio.\n\n\nToday we'll discuss a [bubble chart](https://support.google.com/datastudio/answer/7207785)\nthat can help you understand which queries are performing well for your site, and which could be improved. We'll first\nexplain the main elements in the chart, describing specific settings and how they influence the data. Then we'll provide\nsome pointers on what to look for when analyzing the data.\n\n\nStarting with the good news: you don't need to build the chart from scratch, you can use\n[this template](https://datastudio.google.com/reporting/1e5b5f6a-38d7-4547-a54b-69594681a09b/page/xFbeC/preview), connect to your data,\nand tweak any settings you want.\n\n\n*Without further ado...*\n\nUnderstanding the chart\n-----------------------\n\n\nA **bubble chart** is a great visualization when you have multiple metrics and dimensions because it enables you to see\nrelationships and patterns in your data more effectively. In the example shown here, you can see traffic attributes\n(click-through rate (CTR), [average position](https://support.google.com/webmasters/answer/7042828#position))\nand volume (total [clicks](https://support.google.com/webmasters/answer/7042828#click)) for different dimensions (query, device) at the same time.\n\n\nWe'll go through some of the chart elements to clarify what it shows, and what it doesn't.\n\n### Data source\n\n\nFor this chart, we're using the **Site Impression** table available through the [Search Console data source](https://support.google.com/datastudio/answer/7314895), which includes [Search\nperformance data](https://support.google.com/webmasters/answer/7576553) aggregated by site and queries.\n\n### Filters and data controls\n\n\nIn order to make it easy for you to control your data effectively, we included five customization options in the chart:\n\n1. **[Data control](https://support.google.com/datastudio/answer/7415591)**: Choose the Search Console property you'd like to analyze.\n2. **Date range**: Choose the date range you'd like to see in the report; by default you'll see the last 28 days.\n3. **Query** : Include or exclude queries to focus on. You can [use regular\n expressions](/search/blog/2021/06/regex-negative-match) similar to the way you use them in Search Console.\n4. **Country**: Include or exclude countries.\n5. **Device**: Include or exclude device categories.\n\n### Axes\n\n\nThe axes in the chart are **Average position** (y-axis) and **Site CTR** (x-axis), but we made three significant transformations\nto make the chart more insightful:\n\n- **Reverse y-axis direction**: Since the y-axis shows average position, inverting it means that 1 is at the top. For most business charts, the best position is in the top right corner, so it is more intuitive to invert the y-axis when using it to display average position.\n- **Log scale** : A [logarithmic scale](https://en.wikipedia.org/wiki/Logarithmic_scale) is \"a way of displaying numerical data over a very wide range of values in a compact way (...) moving a unit of distance along the scale means the number has been multiplied by 10\". Using log scale for both axes enables you to have a better understanding of queries that are in the extremities of the chart (very low CTR, average position, or both).\n- **[Reference lines](https://support.google.com/datastudio/answer/9921462)**: The reference line is very helpful to highlight values that are above or below a certain threshold. Looking at the average, median, or a certain percentile can call attention to deviations from the pattern.\n\n### Bubbles\n\n\nEach bubble in the chart represents a single query, and in order to make the chart more useful, we used two\n[style properties](https://support.google.com/datastudio/answer/7207785#style-properties):\n\n- **Size**: Using the number of clicks as the bubble size helps you see in a glance which queries are driving the bulk of the traffic --- the larger the bubble the more traffic the query generates.\n- **Color**: Using the device category as the bubble color helps you understand the differences between mobile and desktop Search performance. You can use any dimension as the color, but as the number of values increases, the harder it is to recognize patterns.\n\nAnalyzing the data\n------------------\n\n\nThe goal of this visualization is to help surface query optimization opportunities. The chart shows query performance, where\nthe y-axis represents **average position** , the x-axis represents **CTR** , the bubble size represents total number of\n**clicks** , and the bubble color represents **device category**.\n\n\nThe red reference lines show the average for each of the axes, which split the chart into quadrants, showing four types of\nquery performance. Your quadrants are likely to look different than the one shared in this post; they'll depend on how your\nsite queries are distributed.\n\n\nIn general, the chart will show four groups you can analyze to help you decide where to invest your time when optimizing your query performance.\n\n1. **Top position, high CTR**: There's not much you need to do for those; you're doing a great job already.\n2. **Low position, high CTR** : Those queries seem relevant to users; they get a high CTR even when ranking lower than the average query on your website. They could represent a significant contribution if their position goes up --- *invest in optimizing them!*\n3. **Low position, low CTR** : When looking at queries with low CTR (this and the next bullet), it's especially interesting to look at the bubble sizes to understand which queries have a low CTR but are still driving significant traffic. While the queries in this quadrant might seem unworthy of your effort, they can be divided into two main groups:\n - *Related queries*: If the query in question is important to you, it's a good start to have it appearing in Search already. Prioritize these queries over queries that are not appearing in Search results at all, as they'll be easier to optimize.\n - *Unrelated queries*: If the query is unrelated to your site, maybe it's a good opportunity to fine-tune your content to focus on queries that will bring relevant traffic.\n4. **Top position, low CTR** : Those queries might have a low CTR for various reasons. You should check the largest bubbles to find signs of the following:\n - Your competitors may have structured data markup and are showing up with rich results, which might attract users to click their results instead of yours. Consider [enabling Search result\n features for your site](/search/docs/appearance/search-result-features).\n - You may have optimized, or be \"accidentally\" ranking, for a query that users are not interested in relation to your site.\n - Users may have already found the information they needed, for example your company's opening hours, address, or phone number.\n\nOptimizing your website performance\n-----------------------------------\n\n\nOnce you find queries that are worth the time and effort, make sure to optimize for them with the help of the\n[SEO starter guide](/search/docs/fundamentals/seo-starter-guide). Here are some tips:\n\n- Ensure that your [`title`](/search/docs/appearance/title-link#page-titles) elements, [description `meta` tags](/search/docs/appearance/snippet#meta-descriptions), and `alt` attributes are descriptive, specific, and accurate.\n- Use heading elements to emphasize important text and help create a hierarchical structure for your content, making it easier for users and search engines to navigate through your document.\n- Add [structured data markup](/search/docs/appearance/structured-data/intro-structured-data) to describe your content to search engines and be eligible to display your content in useful (and eye-catching) ways in search results.\n- Think about the words that a user might search for to find a piece of your content. You can use the [Keyword Planner](https://ads.google.com/home/tools/keyword-planner/) provided by Google Ads to help you discover new keyword variations and see the approximate search volume for each keyword. You can also use [Google Trends](https://trends.google.com/trends/) to find ideas from rising topics and queries related to your website.\n\nFeedback\n--------\n\n\nAs always, let us know if you have any questions through the [Google\nSearch Central Community](https://support.google.com/webmasters/threads?thread_filter=(category:search_console)) or the [Data Studio Community](https://support.google.com/datastudio/threads?thread_filter=(category:connect_to_data)).\nAlso, if you're on Twitter, make sure to [follow us](https://twitter.com/googlesearchc), as we'll announce future posts over there.\n\nPosted by [Daniel Waisberg](https://www.danielwaisberg.com), Search Advocate"]]