เราอยู่ใน LinkedIn แล้วตอนนี้: หากต้องการข่าวสารและแหล่งข้อมูลจาก Google Search เกี่ยวกับการทำให้เว็บไซต์ของคุณค้นพบได้ โปรด
ติดตามเราใน LinkedIn
เจาะลึกการกรองและข้อจำกัดของข้อมูลประสิทธิภาพของ Search Console
จัดทุกอย่างให้เป็นระเบียบอยู่เสมอด้วยคอลเล็กชัน
บันทึกและจัดหมวดหมู่เนื้อหาตามค่ากำหนดของคุณ
วันพุธที่ 19 ตุลาคม 2022
ข้อมูลประสิทธิภาพของ Google Search เป็นข้อมูลที่มีการใช้กันอย่างแพร่หลายใน Search Console ทั้งผ่านรายงานประสิทธิภาพและ Search Analytics API
โพสต์นี้อธิบายข้อมูลที่มีอยู่โดยละเอียดและวิธีที่ Google ประมวลผลข้อมูลเหล่านั้น ซึ่งรวมถึงการกรองความเป็นส่วนตัวและข้อจํากัดอื่นๆ ที่เกี่ยวข้องกับเวลาในการตอบสนองของการแสดงผล พื้นที่เก็บข้อมูล และทรัพยากรในการประมวลผล
เคยสงสัยไหมว่าระบบเหล่านี้ทำงานอย่างไร เรามาเจาะลึกเรื่องนี้กัน
หากยังไม่เคยใช้ Search Console โปรดอ่านข้อมูลเบื้องต้นเกี่ยวกับรายงานประสิทธิภาพ
รายงานประสิทธิภาพจะมีเมตริก 4 รายการที่แสดงให้เห็นว่าปริมาณการค้นหาเปลี่ยนแปลงไปอย่างไรเมื่อเวลาผ่านไป
เรามีบทความซึ่งอธิบายวิธีคํานวณเมตริกแต่ละรายการ
และสรุปเนื้อหาอยู่ที่ด้านล่าง
- การคลิก: จำนวนคลิกของผู้ใช้จากผลการค้นหาของ Google ไปยังพร็อพเพอร์ตี้ของคุณ
- การแสดงผล: จำนวนครั้งที่ผู้ใช้เห็นพร็อพเพอร์ตี้ของคุณในผลการค้นหาของ Google
- CTR (อัตราการคลิกผ่าน): จำนวนคลิกที่หารด้วยจำนวนการแสดงผล
- ตําแหน่ง: อันดับเฉลี่ยในผลการค้นหาสําหรับ URL ข้อความค้นหา หรือเว็บไซต์โดยทั่วไป
คุณวิเคราะห์เมตริกแต่ละรายการเพื่อดูมิติข้อมูลต่างๆ ได้ และสามารถตรวจสอบว่าการค้นหา หน้าเว็บ ประเทศ อุปกรณ์ หรือลักษณะที่ปรากฏในการค้นหาแต่ละรายการที่ทำให้เกิดการเข้าชมเว็บไซต์ของคุณทำงานมีประสิทธิภาพอย่างไร
คุณดูข้อมูลประสิทธิภาพของ Search ได้หลายวิธี เช่น อินเทอร์เฟซของผลิตภัณฑ์, Search Analytics API, เครื่องมือเชื่อมต่อ Looker Studio และสเปรดชีต (ต้องดาวน์โหลดด้วยตนเองจากอินเทอร์เฟซ)
หากคุณใช้อินเทอร์เฟซของผลิตภัณฑ์ มิติข้อมูลจะพร้อมให้ใช้งานผ่านตัวกรองหรือผ่านทางตารางมิติข้อมูลตามแผนภูมิดังที่แสดงในรูปภาพด้านล่าง
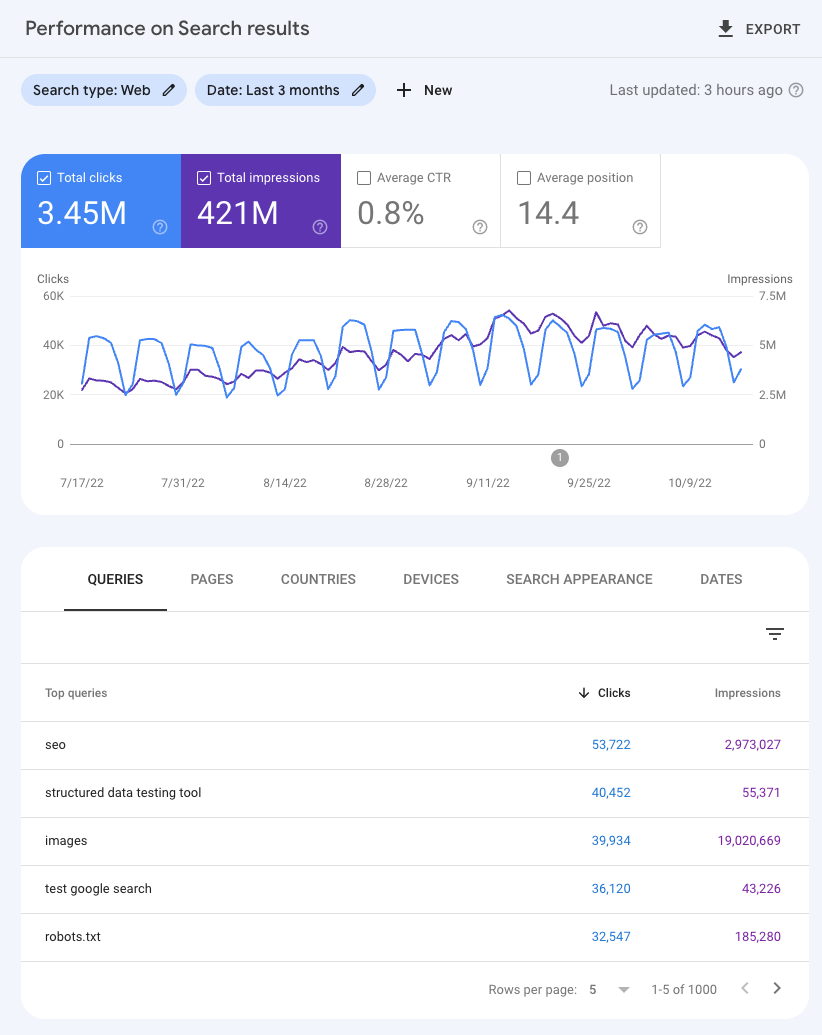
ข้อมูลนี้อาจใช้เพื่อค้นหาวิธีต่างๆ ที่จะทำให้คนเห็นเว็บไซต์มากขึ้นและ เข้าชมเว็บไซต์ของคุณจาก Google ในที่สุด โปรดดูตัวอย่างประเภทการวิเคราะห์ที่คุณดำเนินการได้ที่ตัวอย่างแผนภูมิการเพิ่มประสิทธิภาพ
การกรองและข้อจํากัดของข้อมูล
ทั้งข้อมูลในอินเทอร์เฟซของรายงานและข้อมูลที่ส่งออกจะมีการรวมและกรองด้วยวิธีที่แตกต่างกัน ด้านล่างนี้คือข้อจํากัดหลัก 2 ประการของข้อมูล ได้แก่ การกรองความเป็นส่วนตัวและขีดจํากัดรายวันสำหรับแถวของข้อมูล
การกรองเพื่อความเป็นส่วนตัว
ข้อความค้นหาบางรายการ (เรียกว่าข้อความค้นหาที่ไม่ระบุตัวบุคคล) จะไม่รวมอยู่ในข้อมูล Search Console เพื่อปกป้องความเป็นส่วนตัวของผู้ใช้ที่ทำการค้นหา
ข้อความค้นหาที่ไม่ระบุตัวบุคคลคือข้อความค้นหาที่ไม่ได้ดำเนินการโดยผู้ใช้หลายสิบคนในช่วง 2-3 เดือนที่ผ่านมา เพื่อปกป้องความเป็นส่วนตัว ระบบจะไม่แสดงข้อความค้นหาจริงในข้อมูลประสิทธิภาพของ Search
เราจึงเรียกว่าข้อความค้นหาแบบไม่ระบุตัวตน แม้ว่าจริงๆ ข้อความค้นหาไม่ระบุตัวบุคคลจะไม่ปรากฏในตาราง แต่ระบบจะรวมข้อความเหล่านั้นในผลรวมของแผนภูมิ เว้นแต่ว่าคุณจะกรองตามข้อความค้นหาที่เจาะจง
ลองมาดูตัวอย่างเพื่อให้เห็นภาพได้ชัดขึ้น โปรดทราบว่านี่เป็นภาพจำลองที่ในกรณีที่มีการกรองความเป็นส่วนตัวเท่านั้น สำหรับเรื่องขีดจํากัดรายวันของแถวข้อมูล ซึ่งเราจะพูดถึงในส่วนถัดไป ก็อาจส่งผลกระทบต่อการแสดงข้อมูลได้เช่นกัน โปรดอ่านในส่วนถัดไปเพื่อดูข้อมูลเพิ่มเติม สมมติว่าตารางด้านล่างแสดงจำนวนการเข้าชมทั้งหมดไปยังเว็บไซต์ของคุณจากข้อความค้นหา โดยมีการจำแนกการเข้าชมตามคำค้นหาที่ระบุตัวบุคคล เว็บไซต์ทั่วไปจะมีข้อความค้นหาที่ระบุตัวบุคคลซึ่งได้รับการจำแนกมากกว่า 4 รายการอยู่แล้ว รายการที่จำแนก 4 รายการนี้จึงเป็นเพียงตัวอย่างเท่านั้น
ข้อความค้นหา
|
การคลิก
|
วรรณกรรมคลาสสิก
|
150
|
บทกวี
|
125
|
นิยายวิทยาศาสตร์
|
100
|
สารคดี |
75
|
ยอดรวมของการคลิกจากข้อความค้นหาที่จำแนกรายการ
|
450
|
การคลิกทั้งหมด
|
550
|
หากคุณรวมข้อความค้นหาที่จำแนกรายการทั้งหมดตามที่แสดงในแผนภูมิ คุณจะได้คลิก 450 ครั้ง แต่คลิกทั้งหมดไปยังเว็บไซต์จะเป็น
550 ครั้ง ตัวเลขที่สูงขึ้นเกิดจากการรวมคลิกที่จำแนกรายการทั้งหมด บวกกับ
การคลิกจากข้อความค้นหาที่ไม่ระบุตัวบุคคล ซึ่งไม่ได้แสดงอยู่ในที่นี้
เวลาที่ใช้การรายงาน Search Console จริงๆ คุณอาจเห็นจำนวนที่ต่างกันนี้ได้จาก 2 สาเหตุ
- ตารางรายงานหรือ API (ใส่เข้ามาเพื่อให้เห็นภาพ) จะไม่มีแถวสำหรับข้อความที่ไม่ระบุตัวบุคคล ดังนั้นหากคุณรวมจํานวนคลิกสำหรับทุกแถว จำนวนที่ได้จะไม่เท่ากับผลรวมในแผนภูมิ เช่น ในกรณีนี้ยอดจะเป็น 450 เมื่อรวมแถว แต่จะเป็น 550 ในผลรวมของแผนภูมิ
- ระบบจะละเว้นข้อความค้นหาที่ไม่ระบุตัวบุคคลเมื่อมีการใช้ตัวกรอง ดังนั้นหากคุณเทียบจํานวนคลิกในผลรวมของแผนภูมิกับผลรวมของคลิกที่มี
some_string
และไม่มี some_string
ยอดที่ได้จะไม่เท่ากัน ในกรณีนี้ หากคุณใช้ตัวกรองเพื่อรวมเฉพาะคำค้นหาที่มีคำว่า "นิยาย" คุณจะเห็นจำนวนคลิก 175 ครั้ง และหากยกเว้นคำค้นหาที่มีคำว่า "นิยาย" คุณจะเห็นจำนวนคลิก 275 ครั้ง ยอดรวมการคลิกจะเป็น 450 ครั้ง แต่ยอดรวมในแผนภูมิจะเป็น 550 คลิก
ขีดจํากัดรายวันของแถวข้อมูล
ด้วยข้อจํากัดที่เกี่ยวกับเวลาในการตอบสนองของการแสดงผล พื้นที่เก็บข้อมูล ทรัพยากรในการประมวลผล และอื่นๆ Search Console จะจํากัดจํานวนข้อมูลที่สามารถแสดงหรือส่งออกได้ ข้อจำกัดเหล่านี้จะไม่ส่งผลต่อ
พร็อพเพอร์ตี้ส่วนใหญ่ใน Search Console เว็บไซต์ขนาดใหญ่บางเว็บอาจได้รับผลกระทบจากข้อจำกัดนี้ แต่เราก็เชื่อว่าข้อมูลที่มีอยู่นั้นมากพอที่จะสร้างตัวอย่างข้อมูลที่ครบถ้วน
คุณส่งออกข้อมูลผ่านอินเทอร์เฟซผู้ใช้ของ Search Console ได้มากสุดคือ 1,000 แถว
ปัจจุบัน ขีดจํากัดสูงสุดของข้อมูลที่ส่งออกผ่าน Search Analytics API
(และผ่านเครื่องมือเชื่อมต่อ Looker Studio) คือ 50,000 แถวต่อวันต่อเว็บไซต์ต่อประเภทการค้นหา ซึ่งอาจไม่ถึงในบางกรณี ค่าเริ่มต้นที่แสดงผลโดย API จะเป็น 1,000 แถว แต่คุณสามารถใช้ rowLimit
เพื่อเพิ่มเป็น 25,000 แถว และใช้ startRow
เพื่อดึงแถว 25,001 ถึง 50,000 แถวโดยใช้การแบ่งหน้า อ่านคู่มือนี้เพื่อดูวิธีรับข้อมูลที่มีอยู่
สําหรับคําขอที่ไม่เกี่ยวข้องกับข้อความค้นหาหรือมิติข้อมูล URL เช่น ประเทศ อุปกรณ์ และลักษณะที่ปรากฏในการค้นหา Search Console จะแสดงและส่งออกข้อมูลทั้งหมด
แหล่งข้อมูลและความคิดเห็น
หากต้องการดูข้อมูลเพิ่มเติมเกี่ยวกับเรื่องนี้ โปรดอ่านเอกสารประกอบเกี่ยวกับประสิทธิภาพ
คุณจะพบคําอธิบายเชิงลึกเกี่ยวกับข้อมูลที่มีให้ วิธีใช้รายงานประสิทธิภาพ และรายละเอียดเพิ่มเติมเกี่ยวกับยอดที่ไม่เท่ากันที่คุณอาจพบในแผนภูมิ
หากมีข้อสงสัยหรือข้อกังวลใดๆ โปรดติดต่อเราผ่าน
ชุมชน Google Search Central
หรือใน Twitter
โพสต์โดย Daniel Waisberg Search Advocate
เนื้อหาของหน้าเว็บนี้ได้รับอนุญาตภายใต้ใบอนุญาตที่ต้องระบุที่มาของครีเอทีฟคอมมอนส์ 4.0 และตัวอย่างโค้ดได้รับอนุญาตภายใต้ใบอนุญาต Apache 2.0 เว้นแต่จะระบุไว้เป็นอย่างอื่น โปรดดูรายละเอียดที่นโยบายเว็บไซต์ Google Developers Java เป็นเครื่องหมายการค้าจดทะเบียนของ Oracle และ/หรือบริษัทในเครือ
[null,null,[],[[["\u003cp\u003eGoogle Search Console's Performance report provides data on clicks, impressions, CTR, and position to analyze website search traffic.\u003c/p\u003e\n"],["\u003cp\u003eSearch performance data can be accessed via the product interface, Search Analytics API, Looker Studio Connector, and manual spreadsheet downloads.\u003c/p\u003e\n"],["\u003cp\u003eData is subject to privacy filtering, meaning some queries are anonymized to protect user privacy and may lead to discrepancies in total click counts.\u003c/p\u003e\n"],["\u003cp\u003eA daily data row limit exists for exported data, capped at 1,000 rows via the user interface and 50,000 via the API or Looker Studio Connector.\u003c/p\u003e\n"],["\u003cp\u003eComprehensive resources and support are available through Google Search Central Community and Twitter for further assistance.\u003c/p\u003e\n"]]],["Google Search Console's Performance report provides data on clicks, impressions, CTR, and position, which can be analyzed across queries, pages, countries, devices, and search appearances. Access is available through the interface, API, Looker Studio, and spreadsheets. Data is filtered for user privacy, omitting anonymized queries from tables but including them in totals, and has limits of 1,000 rows via the interface or up to 50,000 via API per day.\n"],null,["# A deep dive into Search Console performance data filtering and limits\n\nWednesday, October 19, 2022\n\n\nGoogle Search performance data is the most widely used data in Search Console, both through the\n[Performance report](https://support.google.com/webmasters/answer/7576553)\nand the [Search Analytics API](/webmaster-tools/v1/searchanalytics/query).\nThis post explains in detail the data available and how Google processes it, including privacy\nfiltering and other limitations related to serving latency, storage, and processing resources.\nEver wonder how these systems work? Let's do a deep dive\ninto them.\n\n\nIf you're new to Search Console, check out the [introduction to Performance reports](https://support.google.com/webmasters/answer/10268906).\n\nSearch performance basics\n-------------------------\n\n\nThe Performance report contains four metrics that show how your search traffic changes over time.\nWe have an article describing [how each metric is calculated](https://support.google.com/webmasters/answer/7042828),\nand here's a summary:\n\n- Clicks: Count of user clicks from Google Search results to your property.\n- Impressions: Count of times users saw your property on Google search results.\n- CTR (Click-through rate): The click count divided by the impression count.\n- Position: The average position in search results for the URL, query, or for the website in general.\n\n\nEach of those metrics can be analyzed for different dimensions. You can check how each of the queries,\npages, countries, devices, or search appearances driving traffic to your website is performing.\n\n\nThere are many ways to access the Search performance data, including the\n[product interface](https://search.google.com/search-console/performance/search-analytics),\nthe [Search Analytics API](/webmaster-tools/v1/searchanalytics/query),\nthe [Looker Studio connector](/search/blog/2022/03/connecting-data-studio),\nand spreadsheets (requires manual download from the interface).\n\n\nIf you're using the product interface, the dimensions are available through the filters or through\nthe dimensions tables following the chart, as shown in the image below.\n\n\nThis data can be used to find ways to make your website more visible and ultimately get more traffic\nout of Google. For a sample of what type of analysis you can perform, check this\n[sample optimization chart](/search/blog/2022/04/performance-optimization-bubble-chart).\n\nData filtering and limits\n-------------------------\n\n\nBoth the data in the report interface and the data exported are aggregated and filtered in different\nways. Below are the two main limitations to the data: privacy filtering and daily data row limit.\n\n### Privacy filtering\n\n\nSome queries (called anonymized queries) are not included in Search Console data to protect the\nprivacy of the user making the query.\n\n\nAnonymized queries are those that aren't issued by more than a few dozen users over a two-to-three\nmonth period. To protect privacy, the actual queries won't be shown in the Search performance data.\nThis is why we refer to them as anonymized queries. While the actual anonymized queries are always\nomitted from the tables, they are included in chart totals, unless you filter by query.\n\n\nLet's look at an example to make it clearer - note that this is an illustration that takes into\naccount only privacy filtering, but daily data row limits, discussed in the next section, may also\nplay a role, read on to learn more. Let's say the table below shows all the traffic for queries to\nyour website, itemizing the traffic from non-anonymized queries. A typical website will generally\nhave more than four itemized non-anonymized queries, of course, but for purposes of this example,\nwe'll say it's just four that are itemized.\n\n|------------------------------|------------|\n| **Queries** | **Clicks** |\n| classic literature | 150 |\n| poetry | 125 |\n| science fiction | 100 |\n| non fiction | 75 |\n| *Total for itemized queries* | *450* |\n| *Total overall* | *550* |\n\n\nIf you add up all the itemized queries, as the chart shows, there were 450 clicks. There are also\n550 overall clicks to the site. That number is higher because it includes all the itemized clicks\nplus the clicks from anonymized queries, which aren't listed.\n\n\nIn practice, when using Search Console reporting, you may notice this type of discrepancy in two main ways.\n\n1. There is no row for anonymized queries in the report table or API (added here for illustration purposes), so if you sum up clicks for all the rows, you'll not find the same number of clicks as the chart totals. For example in this case you'd see 450 when you sum up the rows, but you'd see 550 in the chart totals.\n2. The anonymized queries are omitted whenever a filter is applied, so there will be a discrepancy if you compare the sum of clicks in the chart totals to the sum of clicks containing `some_string` and not containing `some_string`. In this case, if you use filters to include only queries that contain the word \"fiction\", you'll see 175 clicks, and if you exclude queries that contain the word \"fiction\", you'll see 275 clicks, summing up to 450 clicks, while in the chart total you'll see 550 clicks.\n\n### Daily data row limit\n\n\nDue to limitations related to serving latency, storage, processing resources, and others, Search\nConsole has a limit on the amount of data that can be displayed or exported. These limits won't affect\nthe majority of properties in Search Console. A few very large websites can be affected by this, but\neven for those we believe the remaining data will be large enough to create a representative sample of data.\n\n\nThe maximum you can export through the Search Console user interface is 1,000 rows of data.\nCurrently, the upper limit for the data exported through the [Search Analytics API](/webmaster-tools/v1/searchanalytics/query)\n(and through the [Looker Studio connector](/search/blog/2022/03/connecting-data-studio))\nis 50,000 rows per day per site per search type, which may not be reached in all cases. The default\nreturned by the API will be 1,000 rows, but you can use `rowLimit` to increase it to 25,000\nand `startRow` to pull the rows 25,001 to 50,000 using pagination. Check this guide to\nlearn [how to get the available data](/webmaster-tools/v1/how-tos/all-your-data).\n\n\nFor requests that don't involve query or URL dimensions, such as countries, devices, and Search\nAppearances, Search Console will display and export all the data.\n\nResources and feedback\n----------------------\n\n\nIf you'd like to learn more about the subject, read the [Performance documentation](https://support.google.com/webmasters/answer/7576553).\nYou'll find in-depth explanations about the available data, how to use the Performance report, and more\ndetails about discrepancies you may find in the charts.\n\n\nIf you have any questions or concerns, please reach out to us via the\n[Google Search Central Community](https://support.google.com/webmasters/threads?thread_filter=(category:search_console))\nor on [Twitter](https://twitter.com/googlesearchc).\n\nPosted by [Daniel Waisberg](https://www.danielwaisberg.com), Search Advocate"]]