深入瞭解 Search Console 的成效資料篩選與限制
透過集合功能整理內容
你可以依據偏好儲存及分類內容。
2022 年 10 月 19 日,星期三
Google 搜尋成效資料是 Search Console 中最廣為使用的資料,可同時透過成效報表和 Search Analytics API 來使用。本文詳細說明 Google 提供的資料,以及 Google 如何處理資料,包括隱私權篩選功能,以及與服務延遲、儲存和處理資源相關的其他限制。
您知道這些系統的運作方式嗎?讓我們深入探索。
如果您是第一次使用 Search Console,請參閱成效報表簡介。
成效報表中有四種指標會顯示搜尋流量的變化趨勢。
本文提供各項指標的計算方式,摘要說明如下:
- 點擊次數:從 Google 搜尋結果連到資源的使用者點擊次數。
- 曝光次數:使用者在 Google 搜尋結果中看到資源的次數。
- CTR (點閱率):將點擊次數除以曝光次數後所得到的數字。
- 排名:網址、查詢或網站整體搜尋結果的平均排名。
每一項指標都可以針對不同維度加以分析。您可以查看每項查詢、網頁、國家/地區、裝置或搜尋外觀在為網站帶來流量方面所得獲得的成效。
您可以透過多種方式存取搜尋成效資料,包括產品介面、Search Analytics API、Looker Studio 連接器和試算表 (必須從介面手動下載)。
如果您使用產品介面,可以透過篩選器或圖表下方的維度表格取得維度,如下圖所示。
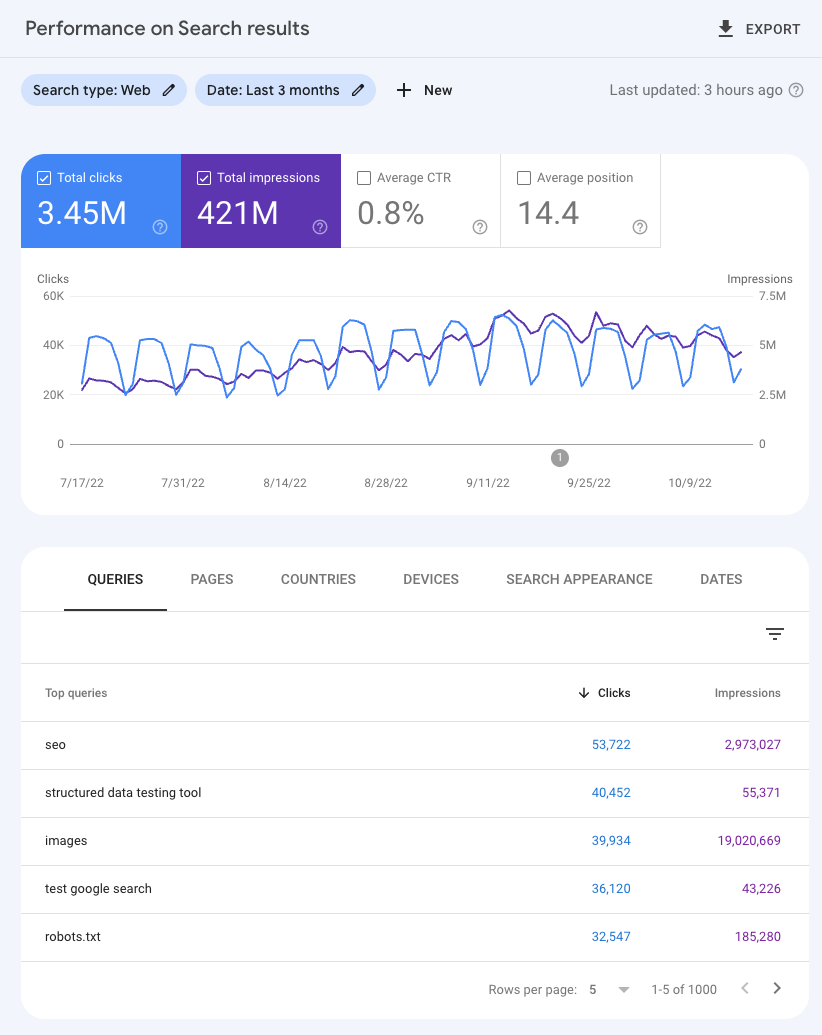
這些資料可用來提高網站能見度,從 Google 獲得更多流量。如需您可以執行的分析類型範例,請參閱這份最佳化圖表範例。
資料篩選與限制
報表介面及匯出的資料都會經過匯總,並以不同方式篩選。以下是資料的兩大限制:隱私篩選和每日資料列上限。
隱私權篩選
有些查詢 (稱為匿名查詢) 並不包含在 Search Console 資料中,目的是保護查詢使用者的隱私權。
匿名查詢是指在二至三個月內,未有超過數十位使用者發出的查詢。為了保護隱私權,實際查詢資料不會顯示在 Google 搜尋成效資料中。
因此,我們將這類查詢稱為「匿名查詢」。雖然系統一律會在資料表中忽略實際的匿名查詢,但這些查詢會納入圖表總數中,除非您依查詢進行篩選。
我們來查看以下範例以說明這一點。請注意,以下插圖僅將隱私權篩選列入考量,但是下一個區段討論的每日資料列上也可能是考量因素之一,請繼續閱讀下文以瞭解詳情。假設下表顯示了為網站查詢的所有流量,將非匿名查詢的流量分項列出。一般情況下,網站通常會有超過四個分項的非匿名查詢,但就本例而言,就只四個分項的非匿名查詢。
查詢
|
點擊次數
|
經典文學 |
150 |
詩詞 |
125 |
科幻小說 |
100 |
非小說 |
75 |
分項查詢總數 |
450 |
總計 |
550 |
如果您將所有分項查詢相加,如圖表所示,就會有 450 次點擊。網站的整體點擊次數也達到 550 次。這個數字較高,因為其中包含所有分項點擊以及匿名化查詢中未列出的點擊。
但實際上,使用 Search Console 報表時,您可能會注意到這類差異主要分為兩種。
- 報表表格或 API 都沒有匿名化查詢的資料列 (這裡加入資料列是為了方便說),因此如果將所有資料列的點擊次數加總,就會發現資料列的點擊次數與圖表中的總數並不一樣。例如,如果將資料列點擊次數加總,總數會是 450,但圖表中的總數卻是 550。
- 每次套用篩選器時,系統就會忽略匿名化查詢,因此,如果您將圖表中的點擊總數與分別包含
some_string
與不包含 some_string
的點擊總數進行比較,就會發現有所差異。在這個範例中,如果您使用篩選器僅加入含有「小說」查詢的點擊次數,會顯示 175 次點擊;如果排除含有「小說」查詢的點擊次數,則會顯示 275 次點擊,總計為 450 次點擊,而在圖表中總計則有 550 次點擊。
每日列數上限
由於服務延遲、儲存、處理資源與其他方面的相關限制,Search Console 對可顯示或匯出的資料量設有限制。這些限制並不會影響 Search Console 中的大多數資源。少數非常大型的網站可能會受到這項限制的影響,但即使是這類的網站,我們認為其餘的資料也足以建立具代表性的資料樣本。
您可以透過 Search Console 使用者介面匯出的資料上限為 1,000 列資料。
目前,透過 Search Analytics API (和透過 Looker Studio 連接器) 匯出的資料上限,是每個網站每天可針對每種搜尋類型匯出 50,000 列的資料 (並非所有情況都能匯出這麼多的資料)。API 傳回的預設資料列為 1,000 列,但您可以使用 rowLimit
將資料列增加至 25,000 列,再使用 startRow
透過分頁功能提取 25,001 列到 50,000 列的資料。請參閱這篇文章,瞭解如何取得可用資料。
如果是與查詢或網址維度 (例如國家/地區、裝置和搜尋外觀) 不相關的要求,Search Console 就會顯示並匯出所有資料。
資源與意見回饋
如要進一步瞭解這個主題,請參閱成效說明文件。您可以透過這份說明文件,進一步瞭解可用資料、如何使用成效報表,以及圖表中可能會出現的差異相關詳情。
如果您有任何問題或疑慮,請透過 Google 搜尋中心社群或 Twitter 與我們聯絡。
發文者:搜尋服務代表 Daniel Waisberg
除非另有註明,否則本頁面中的內容是採用創用 CC 姓名標示 4.0 授權,程式碼範例則為阿帕契 2.0 授權。詳情請參閱《Google Developers 網站政策》。Java 是 Oracle 和/或其關聯企業的註冊商標。
[null,null,[],[[["\u003cp\u003eGoogle Search Console's Performance report provides data on clicks, impressions, CTR, and position to analyze website search traffic.\u003c/p\u003e\n"],["\u003cp\u003eSearch performance data can be accessed via the product interface, Search Analytics API, Looker Studio Connector, and manual spreadsheet downloads.\u003c/p\u003e\n"],["\u003cp\u003eData is subject to privacy filtering, meaning some queries are anonymized to protect user privacy and may lead to discrepancies in total click counts.\u003c/p\u003e\n"],["\u003cp\u003eA daily data row limit exists for exported data, capped at 1,000 rows via the user interface and 50,000 via the API or Looker Studio Connector.\u003c/p\u003e\n"],["\u003cp\u003eComprehensive resources and support are available through Google Search Central Community and Twitter for further assistance.\u003c/p\u003e\n"]]],["Google Search Console's Performance report provides data on clicks, impressions, CTR, and position, which can be analyzed across queries, pages, countries, devices, and search appearances. Access is available through the interface, API, Looker Studio, and spreadsheets. Data is filtered for user privacy, omitting anonymized queries from tables but including them in totals, and has limits of 1,000 rows via the interface or up to 50,000 via API per day.\n"],null,["# A deep dive into Search Console performance data filtering and limits\n\nWednesday, October 19, 2022\n\n\nGoogle Search performance data is the most widely used data in Search Console, both through the\n[Performance report](https://support.google.com/webmasters/answer/7576553)\nand the [Search Analytics API](/webmaster-tools/v1/searchanalytics/query).\nThis post explains in detail the data available and how Google processes it, including privacy\nfiltering and other limitations related to serving latency, storage, and processing resources.\nEver wonder how these systems work? Let's do a deep dive\ninto them.\n\n\nIf you're new to Search Console, check out the [introduction to Performance reports](https://support.google.com/webmasters/answer/10268906).\n\nSearch performance basics\n-------------------------\n\n\nThe Performance report contains four metrics that show how your search traffic changes over time.\nWe have an article describing [how each metric is calculated](https://support.google.com/webmasters/answer/7042828),\nand here's a summary:\n\n- Clicks: Count of user clicks from Google Search results to your property.\n- Impressions: Count of times users saw your property on Google search results.\n- CTR (Click-through rate): The click count divided by the impression count.\n- Position: The average position in search results for the URL, query, or for the website in general.\n\n\nEach of those metrics can be analyzed for different dimensions. You can check how each of the queries,\npages, countries, devices, or search appearances driving traffic to your website is performing.\n\n\nThere are many ways to access the Search performance data, including the\n[product interface](https://search.google.com/search-console/performance/search-analytics),\nthe [Search Analytics API](/webmaster-tools/v1/searchanalytics/query),\nthe [Looker Studio connector](/search/blog/2022/03/connecting-data-studio),\nand spreadsheets (requires manual download from the interface).\n\n\nIf you're using the product interface, the dimensions are available through the filters or through\nthe dimensions tables following the chart, as shown in the image below.\n\n\nThis data can be used to find ways to make your website more visible and ultimately get more traffic\nout of Google. For a sample of what type of analysis you can perform, check this\n[sample optimization chart](/search/blog/2022/04/performance-optimization-bubble-chart).\n\nData filtering and limits\n-------------------------\n\n\nBoth the data in the report interface and the data exported are aggregated and filtered in different\nways. Below are the two main limitations to the data: privacy filtering and daily data row limit.\n\n### Privacy filtering\n\n\nSome queries (called anonymized queries) are not included in Search Console data to protect the\nprivacy of the user making the query.\n\n\nAnonymized queries are those that aren't issued by more than a few dozen users over a two-to-three\nmonth period. To protect privacy, the actual queries won't be shown in the Search performance data.\nThis is why we refer to them as anonymized queries. While the actual anonymized queries are always\nomitted from the tables, they are included in chart totals, unless you filter by query.\n\n\nLet's look at an example to make it clearer - note that this is an illustration that takes into\naccount only privacy filtering, but daily data row limits, discussed in the next section, may also\nplay a role, read on to learn more. Let's say the table below shows all the traffic for queries to\nyour website, itemizing the traffic from non-anonymized queries. A typical website will generally\nhave more than four itemized non-anonymized queries, of course, but for purposes of this example,\nwe'll say it's just four that are itemized.\n\n|------------------------------|------------|\n| **Queries** | **Clicks** |\n| classic literature | 150 |\n| poetry | 125 |\n| science fiction | 100 |\n| non fiction | 75 |\n| *Total for itemized queries* | *450* |\n| *Total overall* | *550* |\n\n\nIf you add up all the itemized queries, as the chart shows, there were 450 clicks. There are also\n550 overall clicks to the site. That number is higher because it includes all the itemized clicks\nplus the clicks from anonymized queries, which aren't listed.\n\n\nIn practice, when using Search Console reporting, you may notice this type of discrepancy in two main ways.\n\n1. There is no row for anonymized queries in the report table or API (added here for illustration purposes), so if you sum up clicks for all the rows, you'll not find the same number of clicks as the chart totals. For example in this case you'd see 450 when you sum up the rows, but you'd see 550 in the chart totals.\n2. The anonymized queries are omitted whenever a filter is applied, so there will be a discrepancy if you compare the sum of clicks in the chart totals to the sum of clicks containing `some_string` and not containing `some_string`. In this case, if you use filters to include only queries that contain the word \"fiction\", you'll see 175 clicks, and if you exclude queries that contain the word \"fiction\", you'll see 275 clicks, summing up to 450 clicks, while in the chart total you'll see 550 clicks.\n\n### Daily data row limit\n\n\nDue to limitations related to serving latency, storage, processing resources, and others, Search\nConsole has a limit on the amount of data that can be displayed or exported. These limits won't affect\nthe majority of properties in Search Console. A few very large websites can be affected by this, but\neven for those we believe the remaining data will be large enough to create a representative sample of data.\n\n\nThe maximum you can export through the Search Console user interface is 1,000 rows of data.\nCurrently, the upper limit for the data exported through the [Search Analytics API](/webmaster-tools/v1/searchanalytics/query)\n(and through the [Looker Studio connector](/search/blog/2022/03/connecting-data-studio))\nis 50,000 rows per day per site per search type, which may not be reached in all cases. The default\nreturned by the API will be 1,000 rows, but you can use `rowLimit` to increase it to 25,000\nand `startRow` to pull the rows 25,001 to 50,000 using pagination. Check this guide to\nlearn [how to get the available data](/webmaster-tools/v1/how-tos/all-your-data).\n\n\nFor requests that don't involve query or URL dimensions, such as countries, devices, and Search\nAppearances, Search Console will display and export all the data.\n\nResources and feedback\n----------------------\n\n\nIf you'd like to learn more about the subject, read the [Performance documentation](https://support.google.com/webmasters/answer/7576553).\nYou'll find in-depth explanations about the available data, how to use the Performance report, and more\ndetails about discrepancies you may find in the charts.\n\n\nIf you have any questions or concerns, please reach out to us via the\n[Google Search Central Community](https://support.google.com/webmasters/threads?thread_filter=(category:search_console))\nor on [Twitter](https://twitter.com/googlesearchc).\n\nPosted by [Daniel Waisberg](https://www.danielwaisberg.com), Search Advocate"]]