image.cumulativeCost()를 사용하여 모든 픽셀에 가장 가까운 소스 위치까지의 최저 비용 경로의 총 비용이 포함된 비용 맵을 계산합니다. 이 프로세스는 서식지 분석(Adriaensen et al. 2003), 유역 분할(Melles et al. 2011), 이미지 세분화(Falcao et al. 2004)와 같은 다양한 맥락에서 유용합니다. 각 픽셀이 이미지를 통과하는 데 드는 미터당 비용을 나타내는 이미지에서 누적 비용 함수를 호출합니다. 경로는 픽셀의 8개 이웃을 통해 계산됩니다. 필수 입력에는 source 이미지(0이 아닌 각 픽셀이 잠재적 소스(또는 경로의 시작)를 나타냄)와 경로를 계산할 maxDistance(미터)가 포함됩니다. 이 알고리즘은 길이가 maxPixels = maxDistance/scale 미만인 모든 경로의 누적 비용을 찾습니다. 여기서 scale은 픽셀 해상도 또는 Earth Engine의 분석 규모입니다.
다음 예는 토지 피복 이미지에서 최소 비용 경로를 계산하는 방법을 보여줍니다.
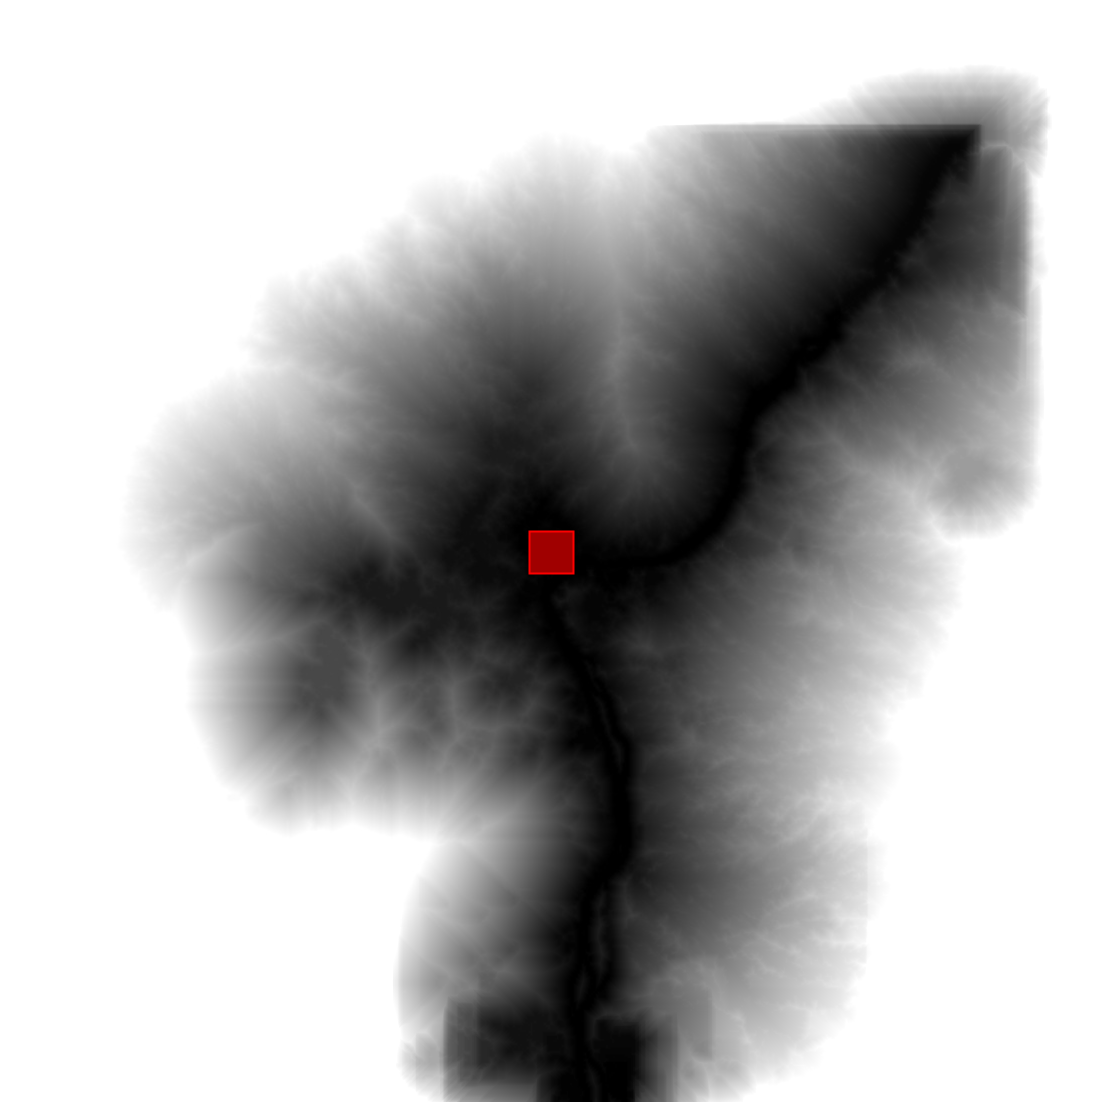
// A rectangle representing Bangui, Central African Republic.
var geometry = ee.Geometry.Rectangle([18.5229, 4.3491, 18.5833, 4.4066]);

// Create a source image where the geometry is 1, everything else is 0.
var sources = ee.Image().toByte().paint(geometry, 1);

// Mask the sources image with itself.
sources = sources.selfMask();

// The cost data is generated from classes in ESA/GLOBCOVER.
var cover = ee.Image('ESA/GLOBCOVER_L4_200901_200912_V2_3').select(0);

// Classes 60, 80, 110, 140 have cost 1.
// Classes 40, 90, 120, 130, 170 have cost 2.
// Classes 50, 70, 150, 160 have cost 3.
var beforeRemap = [60, 80, 110, 140,
                   40, 90, 120, 130, 170,
                   50, 70, 150, 160];
var afterRemap = [1, 1, 1, 1,
                  2, 2, 2, 2, 2,
                  3, 3, 3, 3];
var cost = cover.remap(beforeRemap, afterRemap, 0);

// Compute the cumulative cost to traverse the land cover.
var cumulativeCost = cost.cumulativeCost({
  source: sources,
  maxDistance: 80 * 1000  // 80 kilometers
});

// Display the results
Map.setCenter(18.71, 4.2, 9);
Map.addLayer(cover, {}, 'Globcover');
Map.addLayer(cumulativeCost, {min: 0, max: 5e4}, 'accumulated cost');
Map.addLayer(geometry, {color: 'FF0000'}, 'source geometry');
결과는 그림 1과 같이 표시되며, 여기서 각 출력 픽셀은 가장 가까운 소스까지의 누적 비용을 나타냅니다. 가장 가까운 소스까지의 최소 비용 경로의 길이가 maxPixels를 초과하는 지점에서는 불연속이 발생할 수 있습니다.